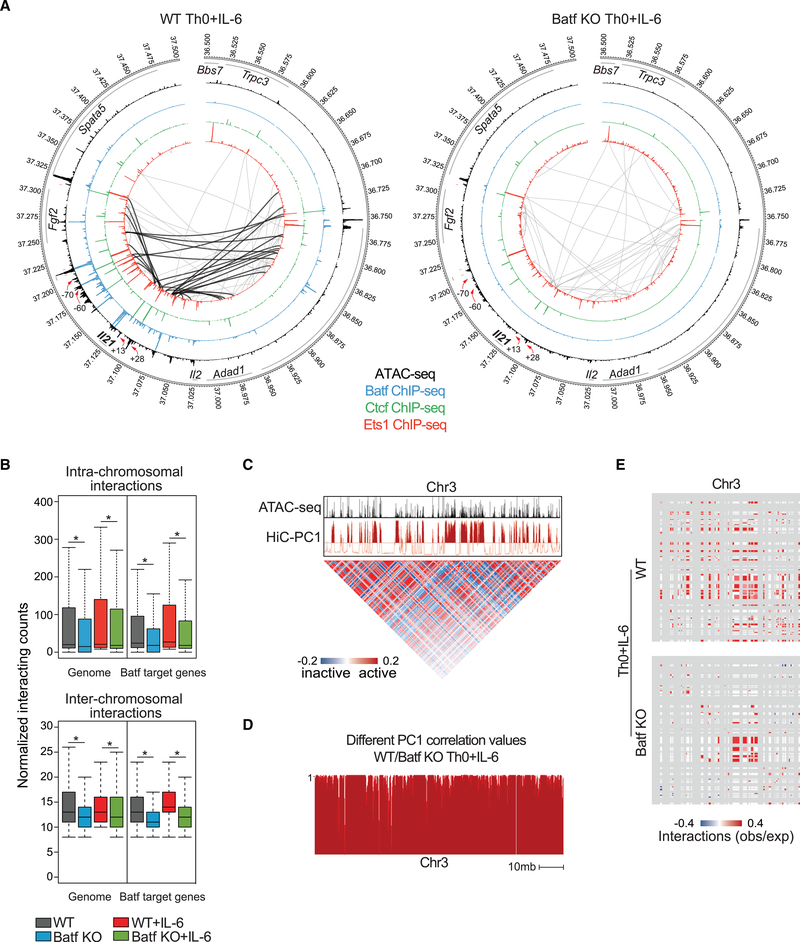
Figure 7. Batf Is Required for Global Chromatin Interaction in Activated CD4+ T Cells.
(A) Circos plots of open chromatin, transcription factor occupancy, and intra-chromosomal interactions in the extended Il21 locus in WT (left) and Batf KO (right) Th0+IL-6 cells; 24-h WT and Batf KO Th0+IL-6 ATAC-seq data are displayed in the largest inner rings (black), and Batf (blue), Ctcf (green), and Ets1 (red) occupancy from 96-h WT and Batf KO Th0+IL-6 ChIP-seq data are shown in sequentially smaller inner rings. Significant (p < 0.005, resolution 10 kb) intra-chromosomal interactions identified by Hi-C analysis of 96-h WT and Batf KO Th0+IL-6 are shown by gray connecting lines. Black lines (left) indicate interactions that are lost in Batf KO cells. Red arrows indicate reduced Batf, Ets1, and Ctcf binding in Batf KO cells compared with WT cells.
(B) Boxplots show the normalized intra- (top, 10 kb resolution) or inter- (bottom, 100 kb resolution) acting frequencies of chromosomal connections across the entire genome or regions containing Batf target genes in 96-h WT and Batf KO Th0 and Th0+IL-6 cells.
(C) Principal-component 1 (PC1) from Hi-C data identified permissive chromatin across chromosome 3 (chr3; red track) aligned with ATAC-seq data (A). Matrix illustrates Pearson’s correlation coefficient of intra-chromosomal interactions in chromosome 3 normalized to observed interaction frequency to expected interaction frequency at 100 kb resolution. Blue, lower than expected (inactive); red, higher than expected (active).
(D) Principal-component analysis of Hi-C data shows inter experimental correlation (different correlation values) calculated by comparing the two interaction profiles at each locus with PC1 values, defined at 50-kb intervals of chr3 for WT and Batf KO Th0+IL-6 cells. The different correlation value is high (close to 1) if the locus is likely to interact with similar regions in both samples and is low if the locus interacts with different regions.
(E) Enrichment of interactions at accessible chromatin (50 kb resolution) in WT (top) and Batf KO (bottom) Th0+IL-6 cells using Structured Interaction Matrix Analysis (SIMA). Colors (red/blue) indicate association calculated as the log ratio of observed frequency to expected frequency (obs/exp).
Data are representative of two independent experiments with similar results. *p < 0.05 (Mann-Whitney test).

