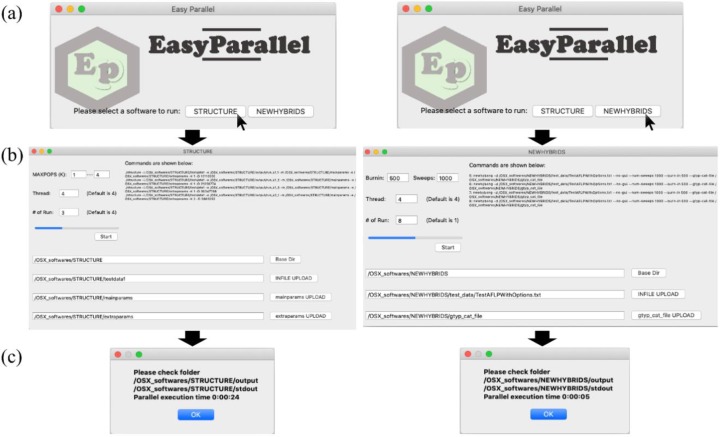
Fig 1. A screenshot of EasyParallel running the STRUCTURE and NEWHYBRIDS analyses in parallel.
(a) EasyParallel main window allows user to choose the STRUCTURE or NEWHYBRIDS module for data analysis. (b) The module panel assisting the user in adding major parameters (e.g. the number of thread or runs) and the input/parameter files. A progress bar at left shows the status of parallelization. A command window at top right shows the commands used for data running. (c) Message window shows the folder storing the outputs and the time to complete the analysis.

