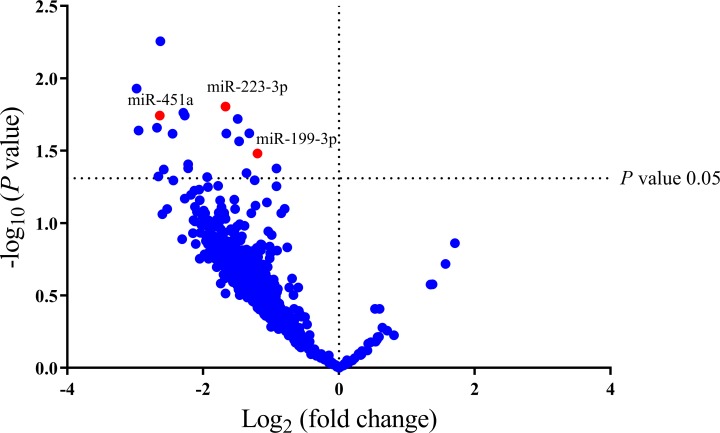
Fig 1. Volcano plot shows the profile of the differential miRNAs expression in 4 tissue samples of patients with HCC.
The x-axis represents the Log2 fold change and y-axis represents significance level expressed as the—log10 P-value. The red 3 dots shown in the volcano plot are the downregulated miRNAs in HCC tissue. The blue dots represent miRNAs that did not demonstrate a significant change in expression. Significance value was indicated with a P-value cut-off of 0.05.

