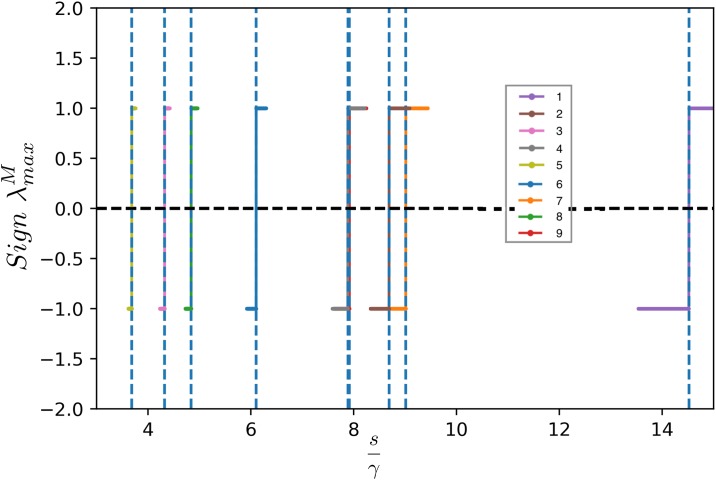
Fig 2. Plot of the sign of the maximum eigenvalue of as a function of the interaction for real networks and constant value of the self limitation term s.
The inset of the figure indicates the number of the real network (1-9) shown in Table 1. The sign of the maximum eigenvalue of changes as a function of where γ is the coupling term and this change of sign occurs at μmax = s where μmax is the maximum eigenvalue of the matrix Γ of the corresponding network. This is represented by the dotted line in this figure, therefore the value of γ for which coincides with the condition of the singularity obtained with the solution to the fixed point equation discussed in Section, i.e. γ for which Re(μmax) = 0 where , for being the adjacency matrix. The networks analyzed are labeled according to the references in Table 1. (Notice that networks 4 and 8 are overlapping).

