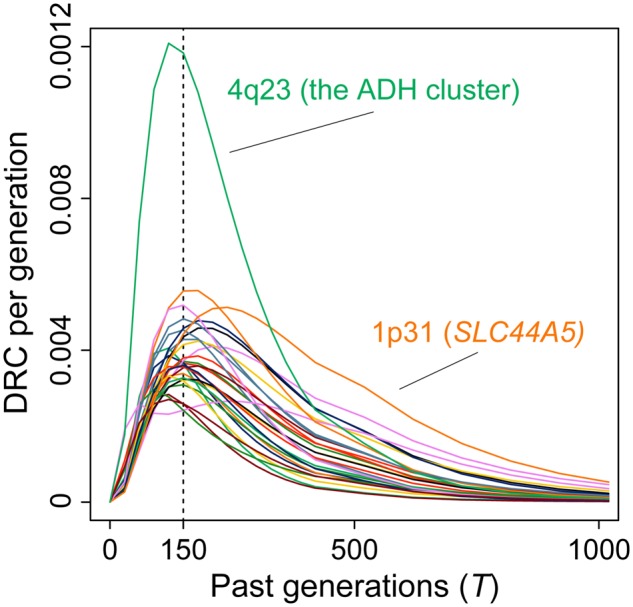
Fig. 3.

Time-series shifts of the DRC values among the loci with natural selection signature. Time-series shifts of the DRC values (per generation) among the 29 loci with significant natural selection signature in the Japanese population detected by ASMC. The x-axis indicates the past generations, and the y-axis indicates the DRC values.
