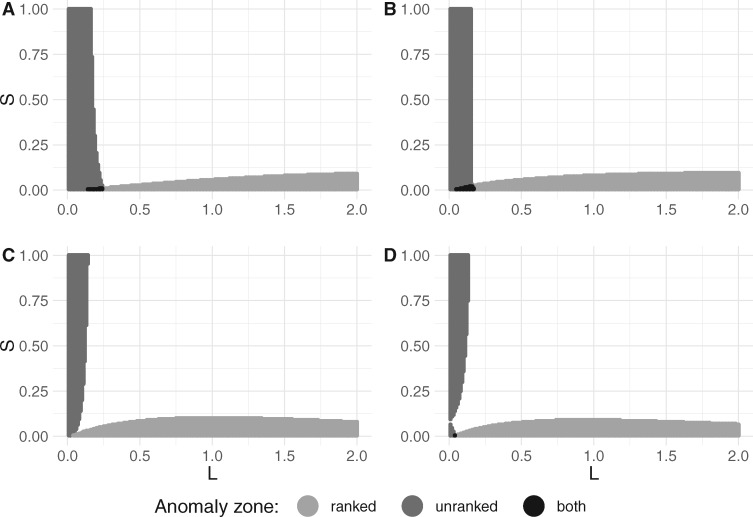
Fig. 4.
2D cross-sections of unranked and ranked anomaly zones, each associated with a six-taxon species tree topology in the corresponding panel of figure 3. (A) Species tree in figure 3A. (B) Species tree in figure 3B. (C) Species tree in figure 3C. (D) Species tree in figure 3D. For each species tree topology, 200 values of and 200 values of were used to identify the existence of anomalous gene trees.

