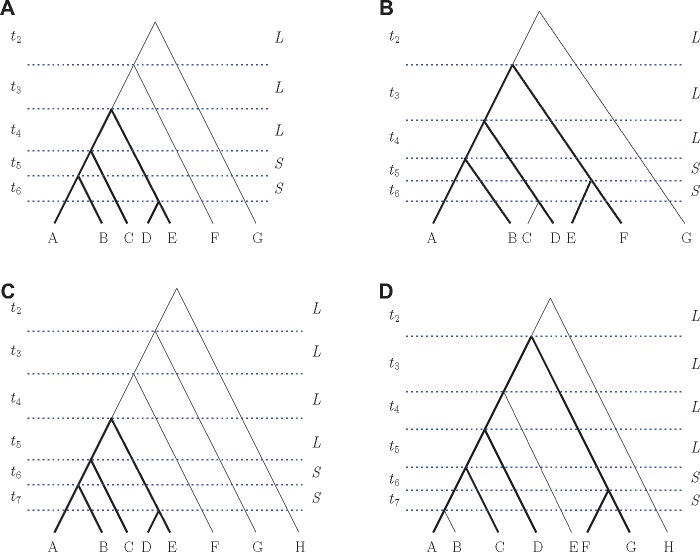
Fig. 5.
Representative labeled rankings of two seven-taxon and two eight-taxon species tree topologies that produce anomalous gene trees. (A, B) Seven taxa. (C, D) Eight taxa. Bold lines indicate a displayed five-taxon tree topology given in figure 2A. We set some lengths of the speciation intervals to be equal to aid in visualization and computation. Two values L and S, measured in coalescent units, are used as interval lengths. All values of L are equal to each other and all values of S are equal to each other. The figures are not drawn to scale.

