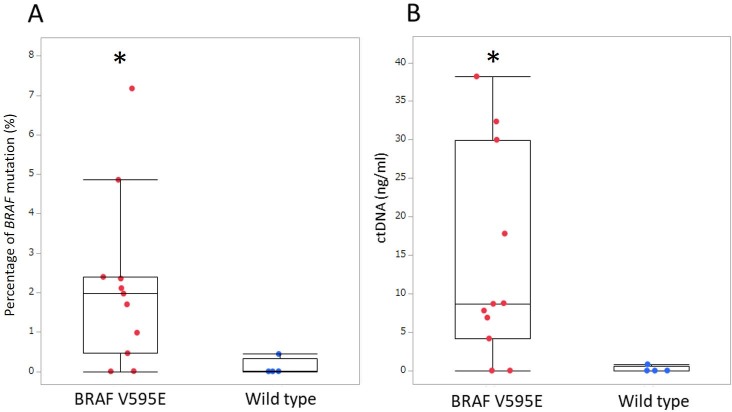
Fig 4.
Box-plot of (A) percentage of the BRAF mutation and (B) BRAF-mutated ctDNA concentration in plasma obtained from dogs with urothelial carcinoma. Each box indicates the 25th and 75th percentiles. The horizontal line inside the box indicates the median, and the whiskers indicate the extreme measured values. * p < 0.05.

