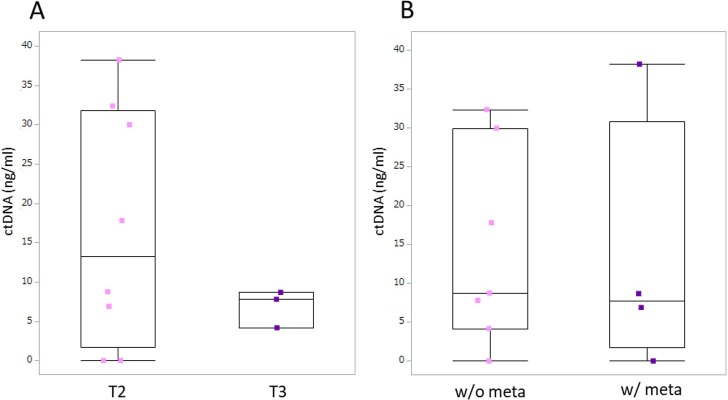
Fig 5. Box-plot of BRAF-mutated ctDNA concentrations in plasma obtained from dogs with urothelial carcinoma.
Each box indicates the 25th and 75th percentiles. The horizontal line inside the box indicates the median, and the whiskers indicate the extreme measured values. A. Local tumor stage. T2: tumor invading the bladder wall; T3: tumor invading neighboring organs. B. Metastasis condition. w/o meta: no evidence of metastasis; w/ meta: metastasis present.

