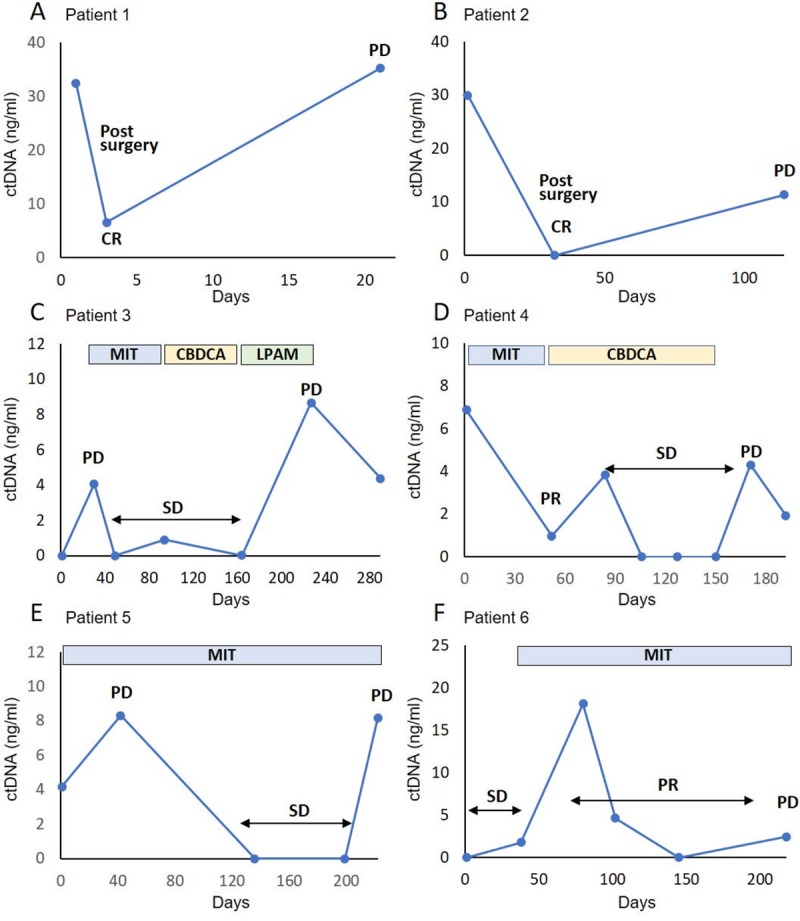
Fig 6. Monitoring of BRAF-mutated ctDNA concentrations according to treatment response.

Mutated BRAF ctDNA levels at various time points in six patients. The vertical axis represents mutated BRAF ctDNA concentration, and the horizontal axis represents the time points of plasma-sampling days. All patients were administrated oral cyclooxygenase-2 inhibitors during treatment. CR, complete response; SD, stable disease; PD, progressive disease; PR, partial response; MIT, mitoxantrone; CBDCA, carboplatin; LPAM, Melphalan.
