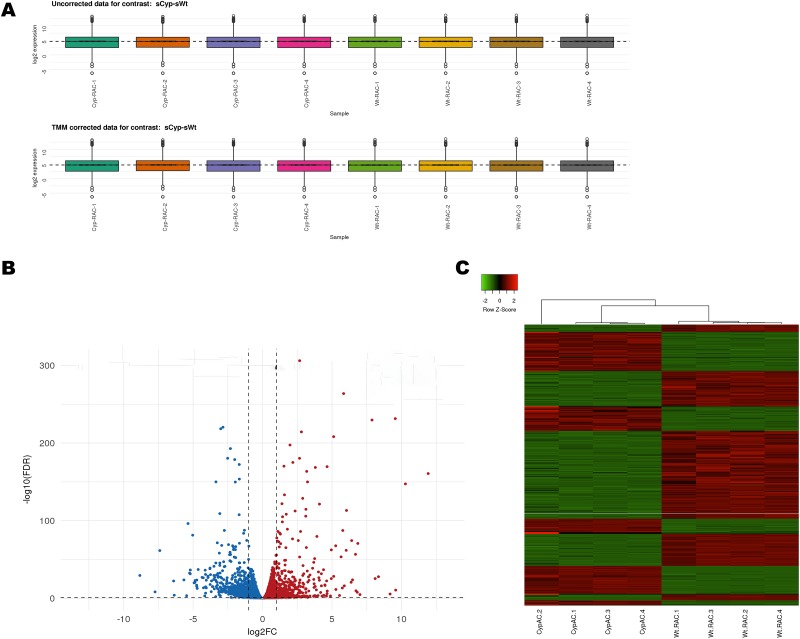
Fig 1. Gene expression profiles of the Cyp1b1+/+ and Cyp1b1-/- retinal AC.
(A) Box plot showing overall TMM expression values for the Cyp1b1-/- AC and control samples. (B) Volcano plot showing differentially express genes. For each plot, the X-axis represents log2 FC and the Y-axis represents -log10 (FDR). The differentially expressed genes (DEG) are shown as red indicating increased expression and blue indicating decreased expression. (C) Hierarchical clustering of DEG. Red indicates increased expression and green indicates decreased expression. The DEG were defined as having absolute FC> 1.5 and an FDR< 0.05.

