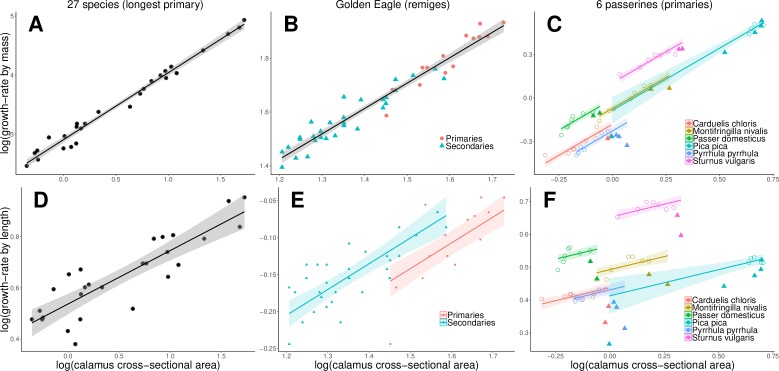
Fig 2. Feather growth-rate and cross-sectional area of the calamus.
Relationships between feather growth-rates by mass (A—C), or alternatively feather growth-rate by length (D—F), and the cross-sectional area of the calamus for three datasets: A and D: longest primary of 27 species, B and E: remiges of Golden Eagle (dots = primaries, triangles = secondaries), C and F: primaries of 6 passerine species (colours; filled triangles = ‘wing-tip primaries’, open circles = ‘proximal primaries‘). The lines indicate the regressions according to the analyses (see Table 1 and S2 Table, S4 Table and S6 Table): A, B, D: for the entire dataset; E: with a different intercept for primaries and secondaries; C and F: for the ‘proximal primaries’ only with a different intercept according to species.

