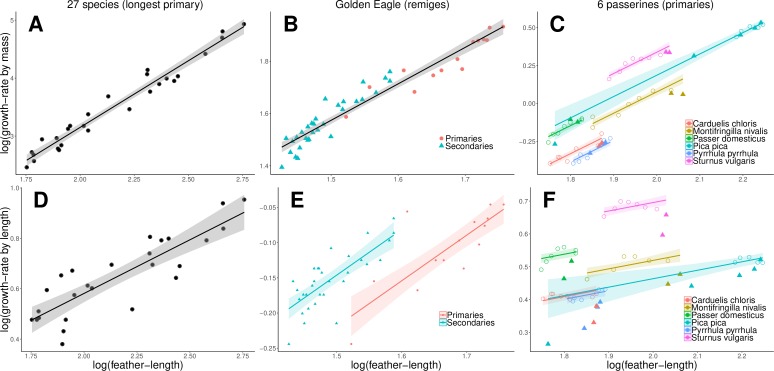
Fig 4. Feather growth-rate and feather-length.
Relationships between feather growth-rates by mass (A-C), or alternatively growth-rate by length (D-F), and feather-length for three datasets: A and D: longest primary of 27 species, B and E: remiges of Golden Eagle (dots = primaries, triangles = secondaries), C and F: primaries of 6 passerine species (colours; filled triangles = ‘wing-tip primaries’, open circles = ‘proximal primaries‘). The lines indicate the regressions according to the analyses (see Table 2 and S2 Table, S4 Table and S6 Table): A, B, D: for the entire dataset; E: with a different intercept for primaries and secondaries; C and F: for the ‘proximal primaries’ only with a different intercept according to species. Golden Eagle growth-rate by length: Note that the outlier primary near the upper end of the regression line for secondaries is the only innermost primary analysed which is more similar in shape to the secondaries than the other primaries.

