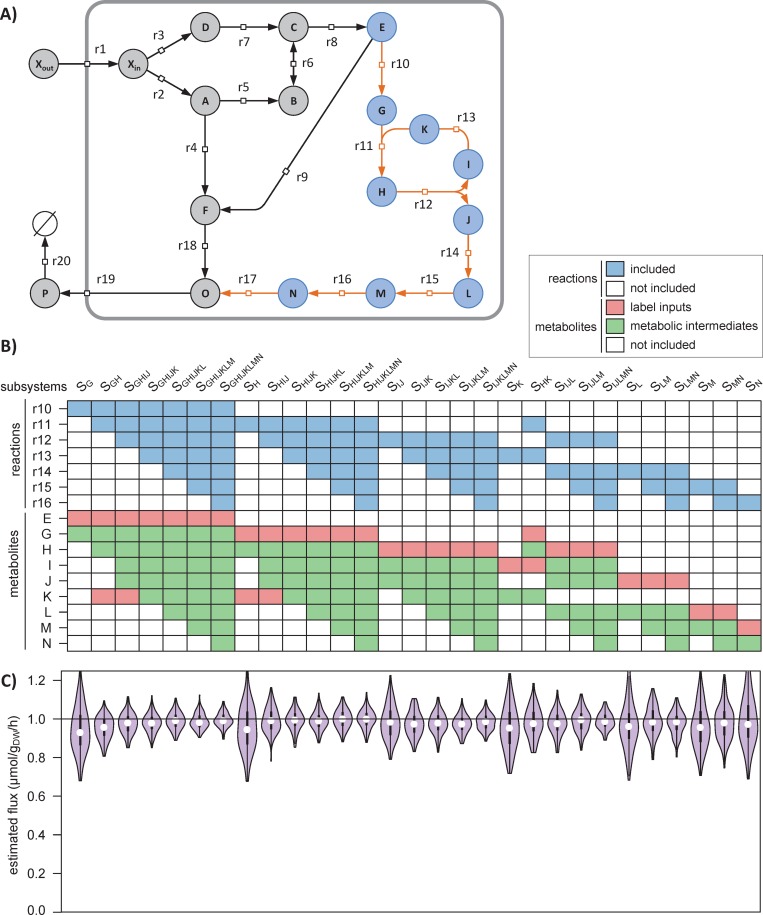
Fig 4. Demonstration of the scalability of ScalaFlux.
The absolute flux through the pathway r10-r16 (orange reactions in panel A) can be quantified in 29 different subsystems (columns in panel B), each of which i) include different reactions (in blue) and ii) exploit different sets of measurements (labeling of local label inputs in red, and concentrations and labeling of metabolic intermediates in green). The fluxes estimated for each subsystem are shown in panel C and are compared to the true value (1.0 μmol/gDW/h, horizontal line).

