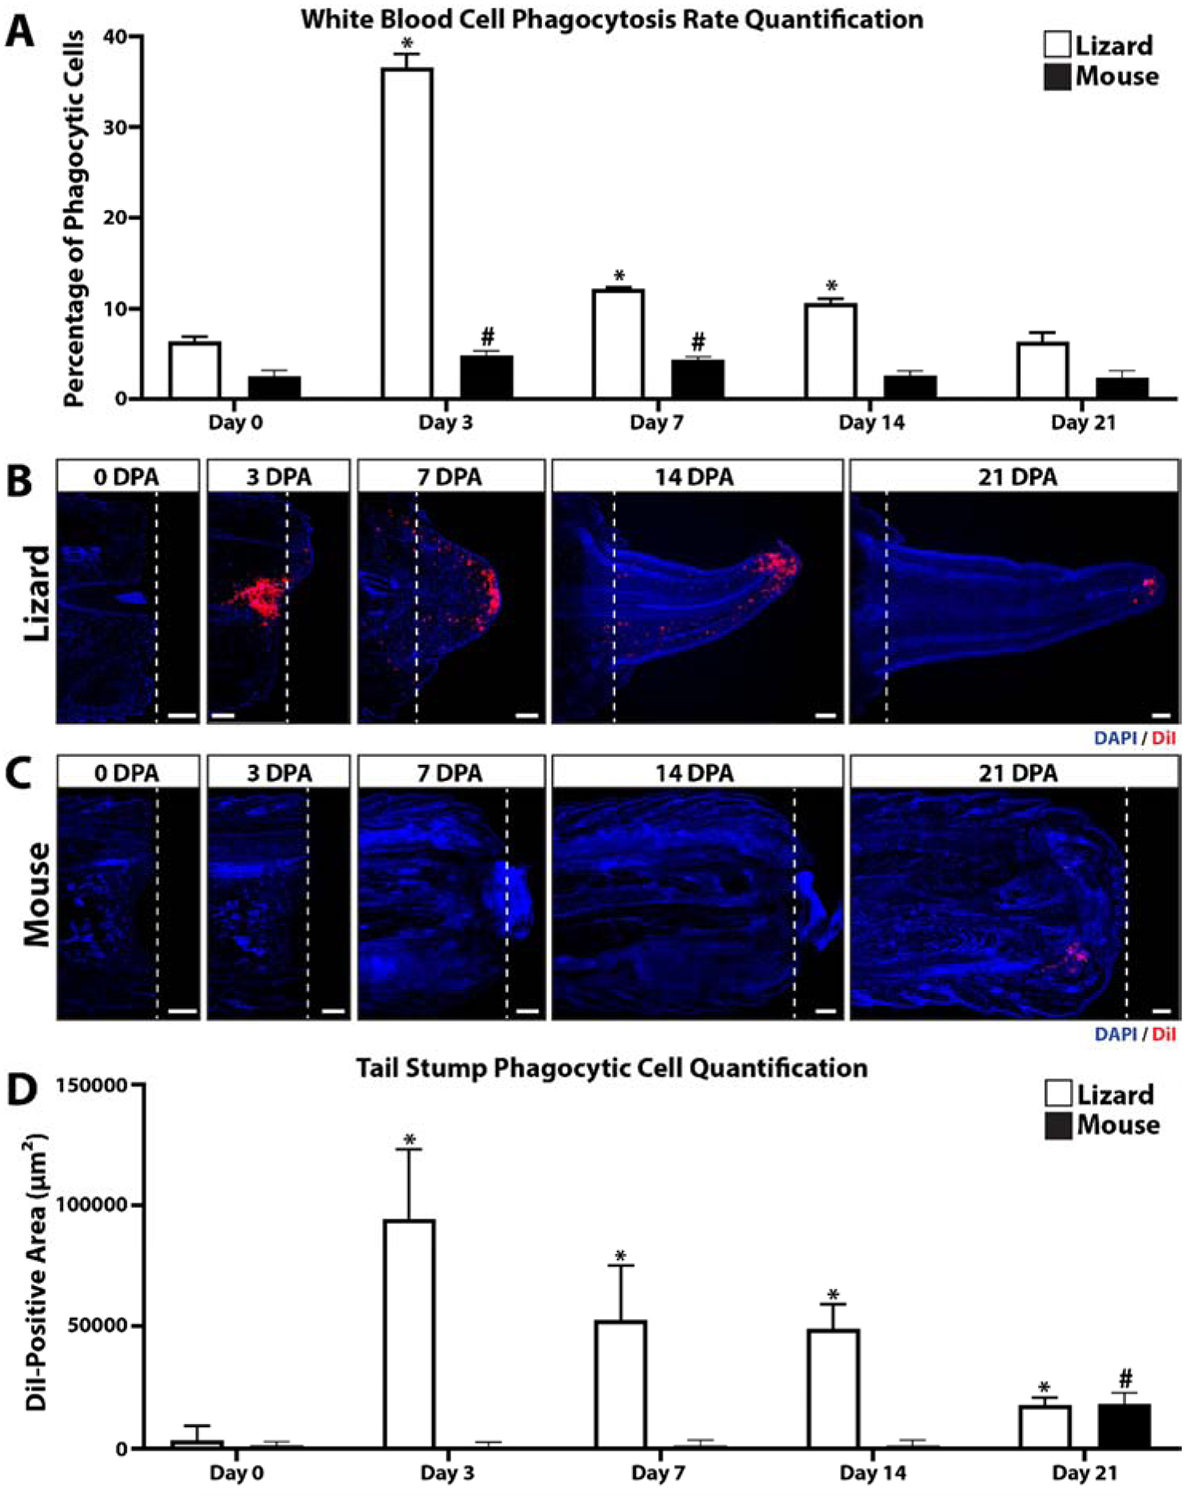
Figure 1: Lizard tail amputation stimulates peripheral blood cell phagocytosis and recruitment of phagocytic cells to regenerating tails.

(A) Phagocytosis assay analysis of mouse and lizard blood cells collected 0, 3, 7, 14, and 21 days post-tail amputation (DPA). N= 3. * p<0.05, compared to lizard 0 DPA; # p<0.05, compared to mouse 0 DPA. (B, C) Histological analysis of (B) lizard and (C) mouse tail samples collected 0, 3, 7, 24, and 21 DPA. Phagocytic cells were labeled by uptake of DiI-containing liposomes, and sampled were counterstained with DAPI. Dashed lines denote amputation planes. Bar = 250 μm. (B) Quantification of lizard and mouse phagocytosis levels detected in tail histology samples 0–21 DPA. N= 3. * p<0.05, compared to lizard 0 DPA; # p<0.05, compared to mouse 0 DPA.
