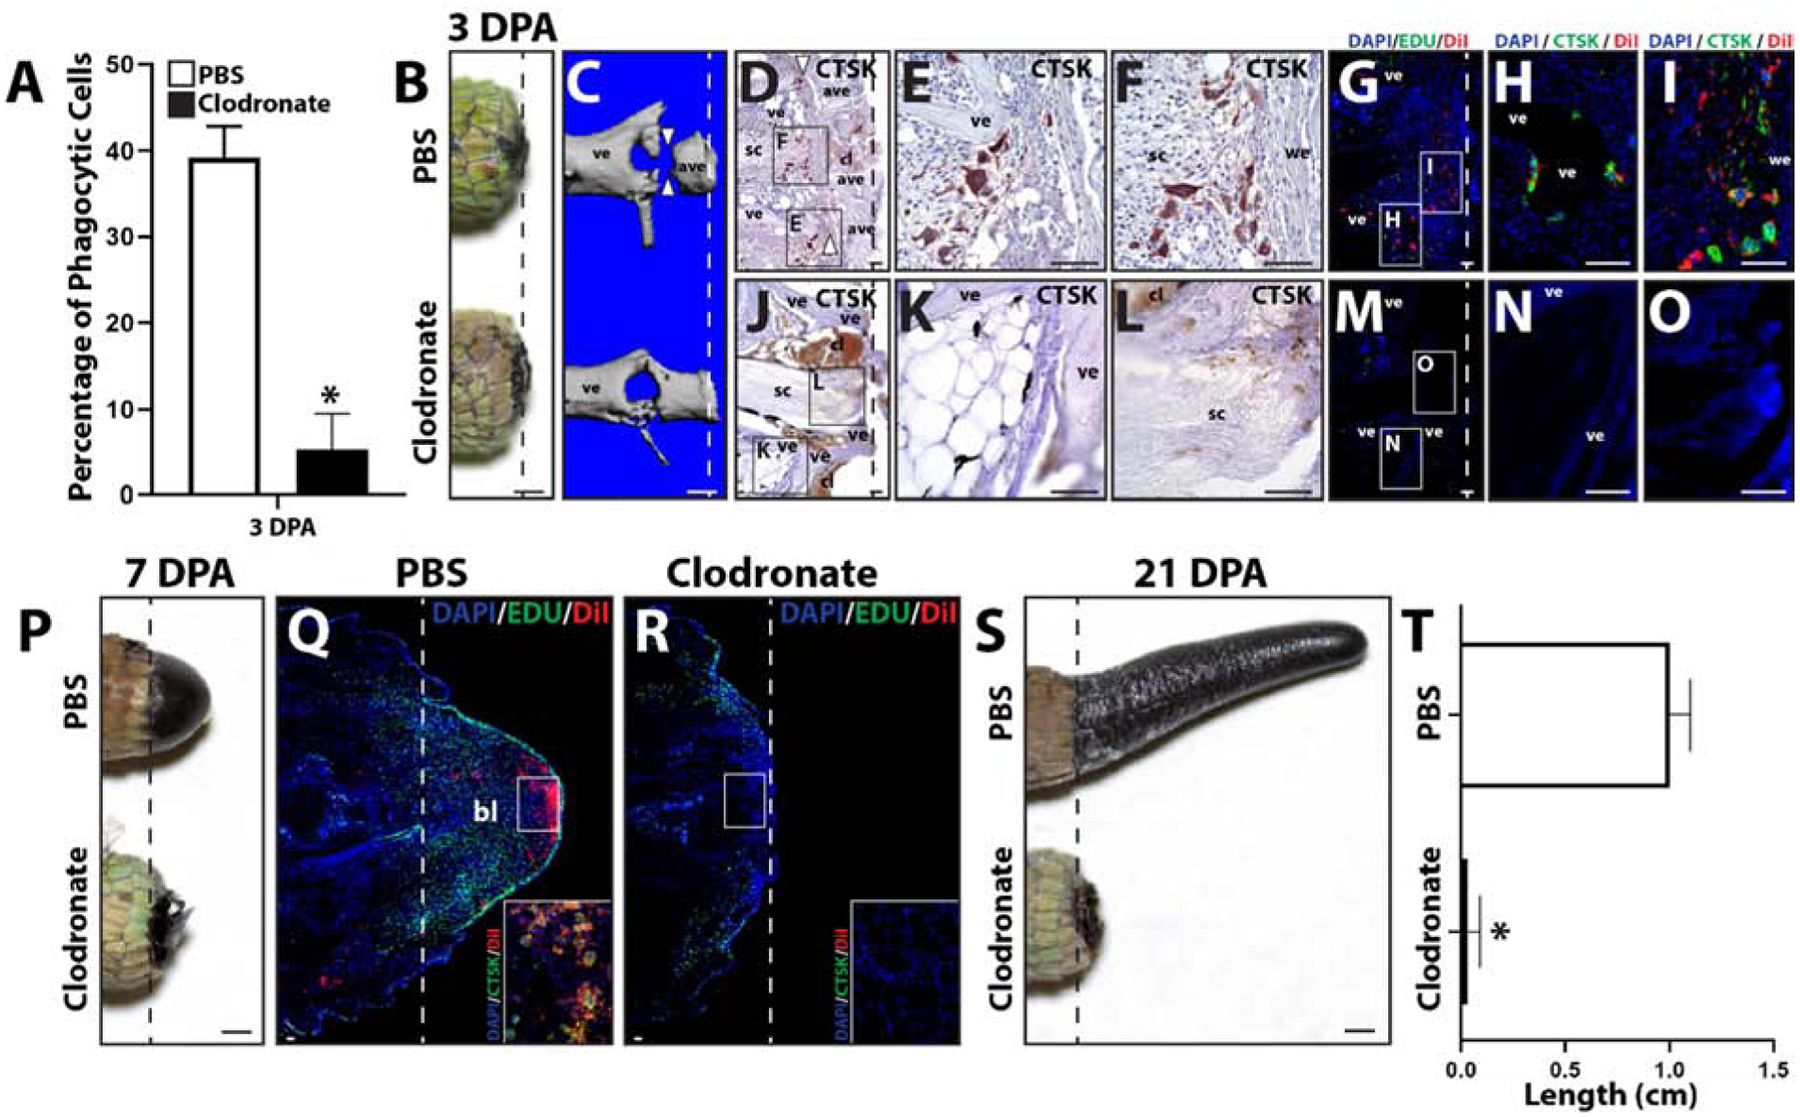
Figure 2: Treatment with clodronate liposomes depletes both peripheral blood and regenerating tail phagocytic cells and inhibits tail regeneration.

(A) Phagocytosis assay analysis of 3 DPA blood samples collected from lizard treated with clodronate or PBS (control) liposomes. N=3. * p<0.05, compared to PBS liposome condition (t-test). (B, C) Comparison of tails collected from lizards treated with PBS or clodronate liposomes 3 DPA by (B) gross morphology and (C) microCT. White arrow heads denote “cuts” in ablated vertebrae. (D) Brightfield micrograph of a sagittal section from a PBS liposome-treated lizard tail sample (3 DPA) analyzed by CTSK immunohistochemistry (red). White arrow heads mark sites of vertebra ablation. (E, F) Higher magnification views of separate CTSK+ cell populations associated with (E) vertebrae and (F) wound epithelium identified in Panel D. (G) Fluorescence micrograph of a sagittal section from a tail histology sample collected 3 DPA from a lizard co-treated with PBS and DiI liposomes and analyzed by CTSK immunostaining. (H, I) Higher magnification views of CTSK+ populations associated with (H) vertebrae and (I) wound epithelium identified in Panel G. (J) Brightfield micrograph of a sagittal section from a clodronate liposome-treated tail sample (3 DPA) analyzed by CTSK immunohistochemistry. (K, J) Higher magnification views of (K) vertebrae and (L) spinal cord regions identified in Panel J showing lack of CTSK+ cells. (M) Fluorescence micrograph of a sagittal section from a clodronate and DiI liposome-treated lizard tail sample collected 3 DPA and analyzed by CTSK immunostaining. (N, O) Higher magnification views of (H) vertebral and (I) central regions identified in Panel M showing lack of CTSK+ and DiI+ cells. (P) Comparison of tails collected from lizards treated with PBS or clodronate liposomes 7 DPA. (Q, R) Histological analysis of (Q) PBS and (R) clodronate liposome-treated lizard tails 7 DPA, including Edu staining of proliferative cells and DiI-labeling of phagocytic cells. Insets present higher magnification views of regions identified in Panels Q and R analyzed by CTSK immunostaining to highlight the accumulation of CTSK+ DiI+ cells in PBS, but not clodronate, liposome-treated tails. (E) Comparison of tails collected from lizards treated with PBS or clodronate liposomes 21 DPA. (F) Quantification of the effects of treatment with PBS or clodronate liposomes on regenerated lizard tail lengths. N=5. * p<0.05. Dashed lines denote amputation planes. ave, ablated vertebra; bl, blastema; cl, clot; sc, spinal cord; ve, vertebra; we, would epithelium. Bar = 1 mm or 100 μm.
