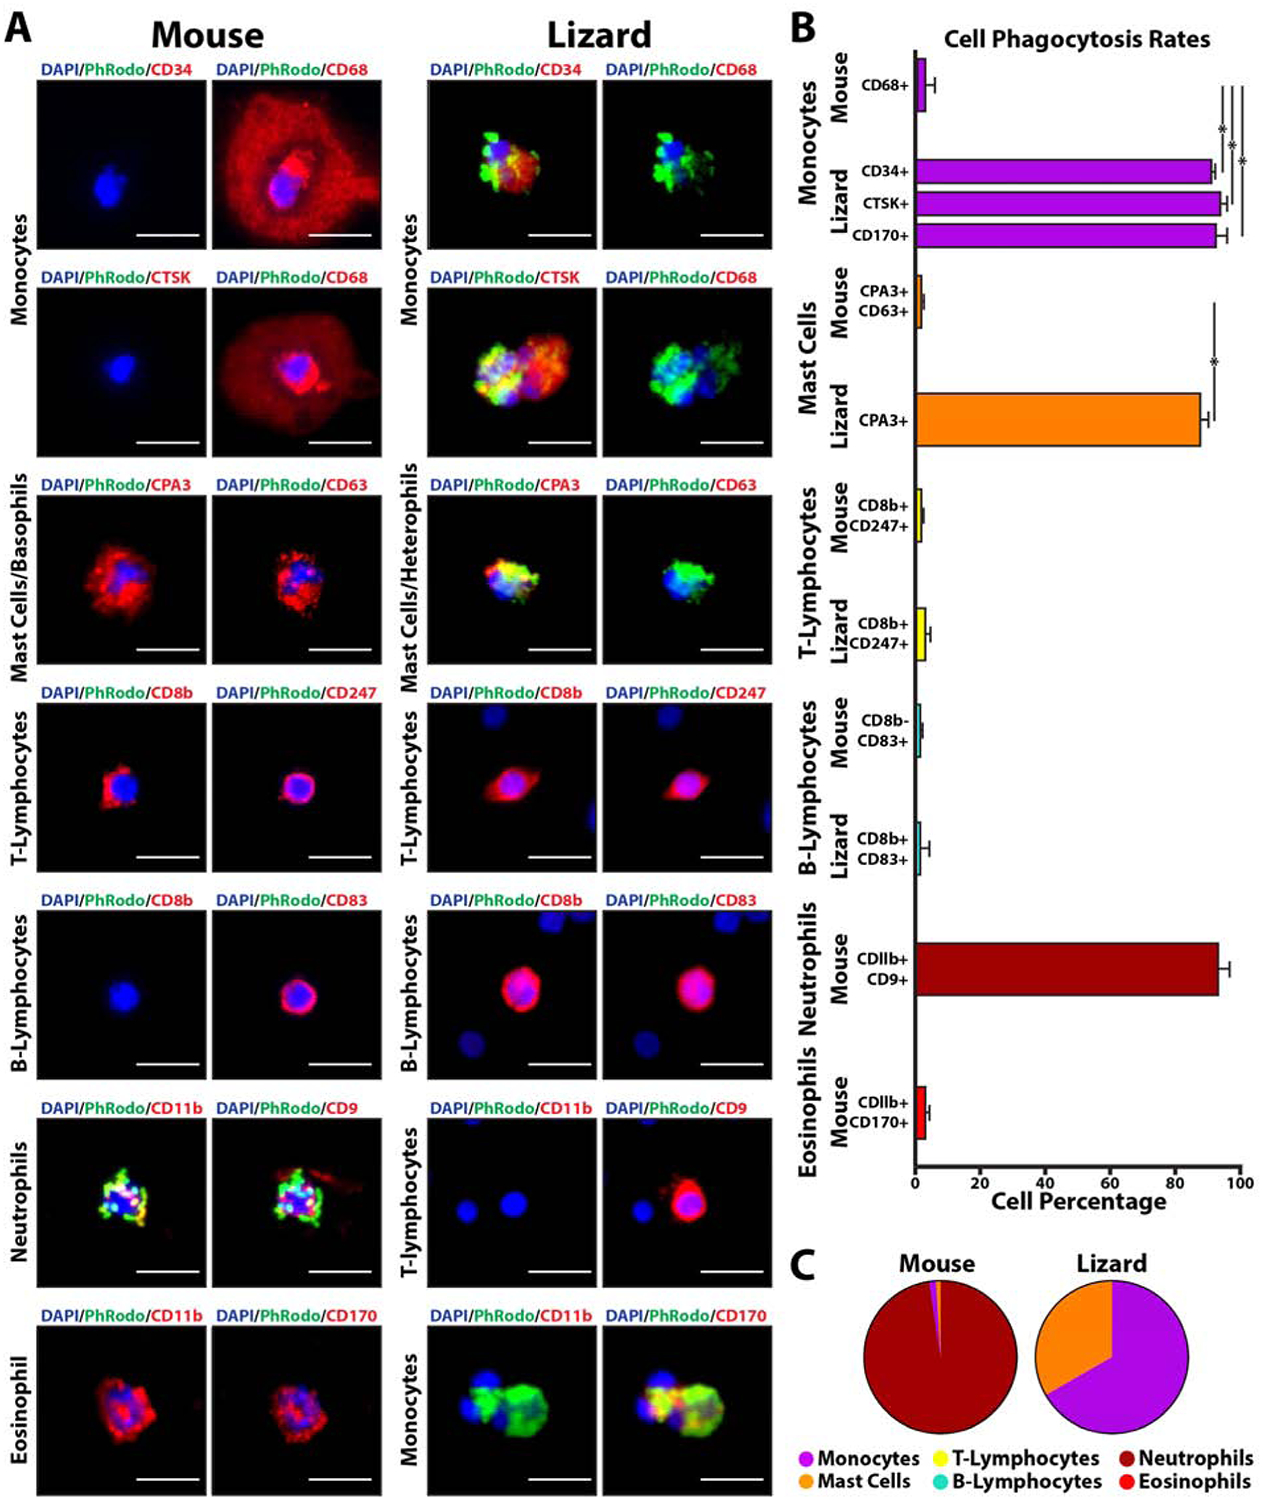
Figure 4: Comparisons of lizard and mouse immune cell markers and phagocytosis rates.

(A) Lizard and mouse peripheral blood cells co-analyzed by pHrodo phagocytosis assays and immunostaining. Signal from pHrodo bioparticles are presented in green, while immunostaining utilizing antibodies to various immune cell markers are shown in red. Cell classifications as monocytes, mast cells, T-lymphocytes, B-lymphocytes, neutrophils, and eosinophils are based on marker expression results (see text). Bar = 25 μm. (B) Histogram depicting quantification of phagocytosis rates of lizard and mouse immune cells separated by marker expression/cell type. Percentages for each cell type are presented (i.e. From the lizard monocyte section, ~92% of CD34+ cells are phagocytic). N=10. * p<0.001 (C) Pie charts presenting contribution percentages of each cell type to total number of mouse and lizard phagocytic cells (i.e. From the right pie chart, 68.2% of total lizard phagocytic cells are identifiable as monocytes). N=10.
