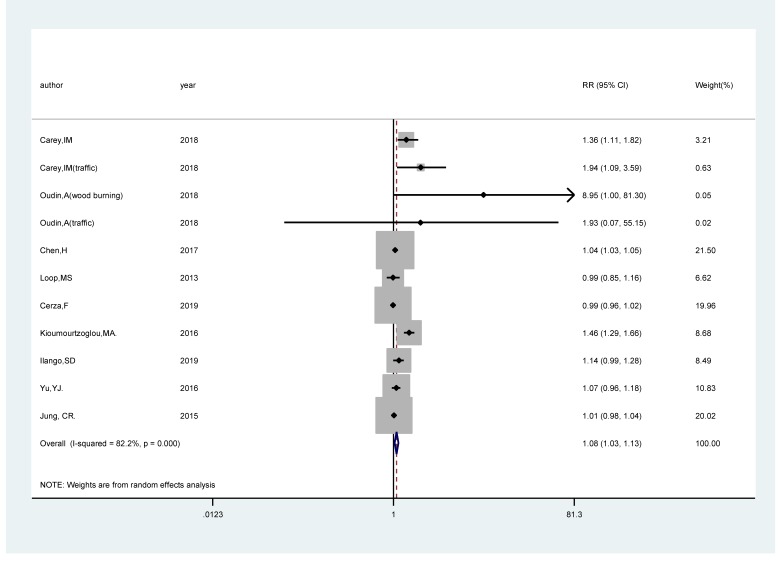
Figure 2.
Forest plot for the pooled relative ratio (RR) and 95% confidence interval (CI) of studies on PM2.5 exposure (per 5 μg/m3 increment) with cognitive impairment. The size of the gray box is positively proportional to the weight assigned to each study, and horizontal lines represent the 95% CI.

