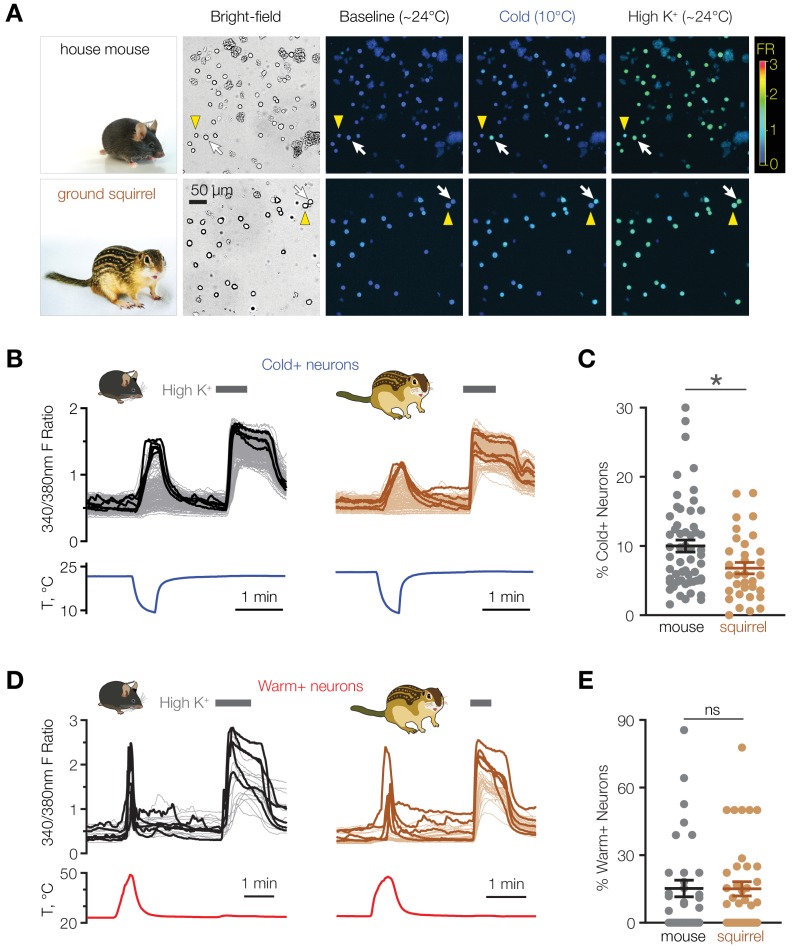
Figure 1. Mice have a higher proportion of cold-sensitive POA neurons than ground squirrels.
(A) Representative bright-field and ratiometric calcium images of POA neurons from house mouse and thirteen-lined ground squirrel at baseline (~24°C), after cooling to 10°C, and after perfusion with 116 mM [K+] (“High K+”) demonstrate cold-sensitive (white arrows) and cold-insensitive (yellow arrowheads) POA neurons. Ratiometric images are pseudocolored according to the fluorescence ratio (FR) scale bar. Photos courtesy of the Gracheva laboratory. (B) Fluorescent ratio traces in response to a cooling ramp for individual POA neurons from a representative coverslip from mouse (left panel, N = 182 neurons) and ground squirrel (right panel, N = 129 neurons). POA neurons were harvested and plated on multiple coverslips per animal as shown in Figure 2A. Five neurons with the highest cold response amplitude are highlighted with thick lines. (C) Percentage of cold-sensitive (“Cold+”) POA neurons in mice and ground squirrels. *p<0.05, Mann-Whitney test. Each data point represents one coverslip. The horizontal line and error bars denote mean and SEM. N = 56 coverslips from 13 mice vs 33 coverslips from nine ground squirrels. (D) Fluorescent ratio traces in response to a warming ramp for individual POA neurons from a representative coverslip from mouse (left panel, N = 18 neurons) and ground squirrel (right panel, N = 28 neurons). Five neurons with the highest warm response amplitude are highlighted with thick lines. (E) Percentage of warm-sensitive (“Warm+”) POA neurons in mice and ground squirrels. p>0.05 (‘ns’), Mann-Whitney test. Each data point represents one coverslip. N = 33 coverslips from 6 mice vs 39 coverslips from 7 ground squirrels.

