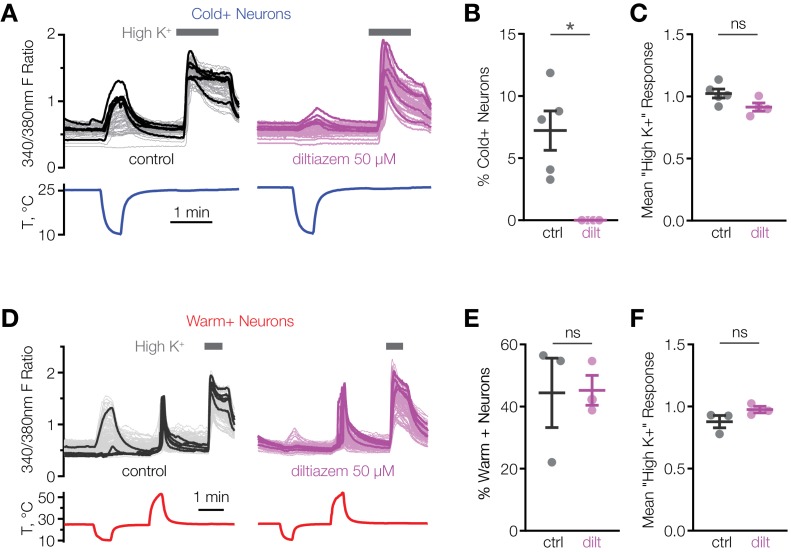
Figure 3. L-cis-diltiazem inhibits cold-activated neurons in mouse POA.
(A and D) Fluorescent ratio traces in response to a cooling (A) or warming (D) ramp for individual POA neurons from a representative coverslip in the absence (left panels, A: N = 49 neurons, D: N = 145 neurons) or in the presence (right panels, A: N = 39 neurons, D: N = 103 neurons) of 50 µM l-cis-diltiazem. Five neurons with the highest cold or warm response amplitude are highlighted with thicker lines. (B and E) Percentage of cold-sensitive (“Cold+”) or warm-sensitive (“Warm+”) POA neurons in the absence (‘ctrl’) or in the presence of 50 µM l-cis-diltiazem (‘dilt’). B: *p<0.05, E: p>0.05 (‘ns’), Welch’s t-test. Each data point represents one coverslip. The horizontal line and error bars denote mean and SEM. N = 4–5 coverslips from two mice in (B), 3 coverslips from one mouse in (E). (C and F) Per-coverslip average of the maximal response of all POA neurons recorded in the experiments in (B) and (E) to 116 mM [K+] solution. p>0.05 (‘ns’), Welch’s t-test.

