. 2020 Apr 14;9:e53085. doi: 10.7554/eLife.53085

Figure 2. Transcriptomes of the developing mouse and human trachea.

(A) Cartoons of the mammalian trachea anatomy. (B) Four developmental stages are included in this study: embryonic day 15 (E15), E16, postnatal day 1 (P1), and P4. Heat map illustrating the average expression levels of marker genes for each cell cluster identified at E15, E16, P1 and P4. Gene expression has been normalized, log-transformed, and z-score transformed. The proportion of cell types and cell states at different developmental stages are shown in Figure 2—figure supplement 1. A list for differentially expressed genes for all cell types is included in Figure 2—source data 1. (C) Heat map showing the average expression levels of cell identity marker genes for all cell types identified in human fetal trachea of gestation week (GW) 21–23. Gene expression has been normalized, log-transformed, and z-score transformed. (D) Dot plot depicting expression patterns of mouse and human orthologous cell types and states identified from this study. The size of the dot encodes the percentage of cells expressing the gene, while the color encodes the mean of expression level which has been normalized, log-transformed, and z-score transformed. Cell type legends for (B–D) Basl: basal cells; BaslSE: basal_surface epithelium; BaslSMG: basal_submucosal glands; Cil: ciliated cells; CilSec: cilia-secretory hybrid cells; Sec: secretory cells; SecSMG: secretory cells_submucosal gland; Hybrid: cilia-scretory hybrid cells; CyEp: cycling epithelium; EpECM: epithelium_ECM+​ ​; MyoEp: myoepithelium; Schw: Schwann cell precursors; Nec: neuronal cells; Imm: immune cells; VaEn: vascular endothelium; LyEn: lymphatic endothelium; ASM: airway smooth muscles: Chon: chondrocytes; MeP: mesenchymal progenitors; Fib: fibroblasts; CyFi: cycling fibroblasts; Pro: progenitor (human). (E) Summary of cell types and marker genes reflecting similarity and distinction between mouse embryonic and neonatal trachea and human fetal trachea.

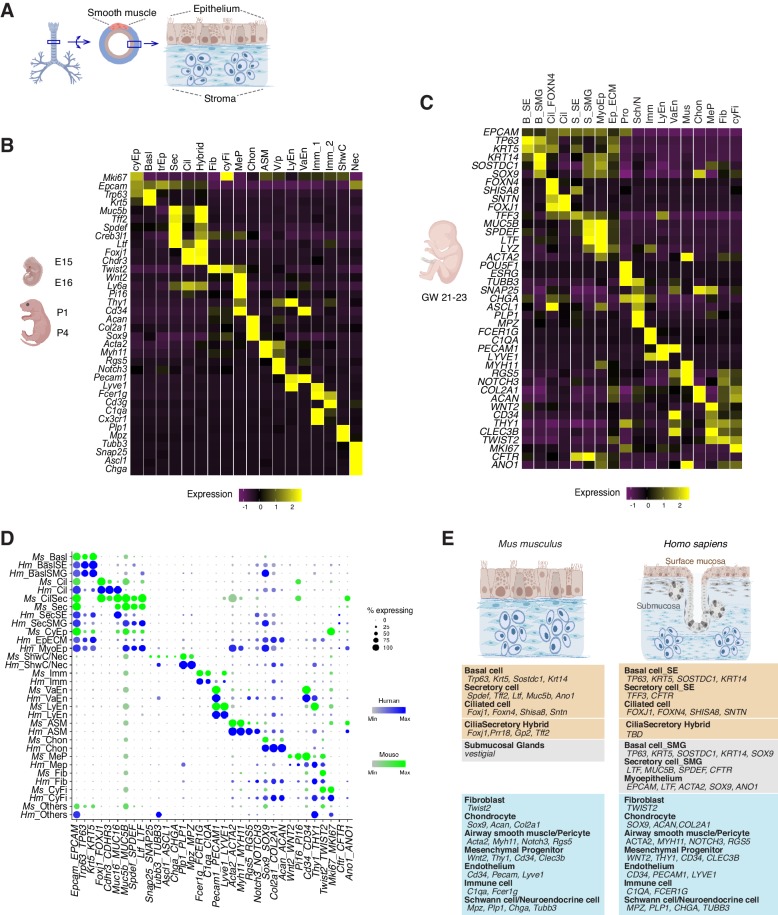
Figure 2—source data 1. Gene lists for all cell types identified from the developing mouse airway.

Figure 2.

Figure 2—figure supplement 1. Construction of the developing mouse trachea atlas.

Figure 2—figure supplement 1.

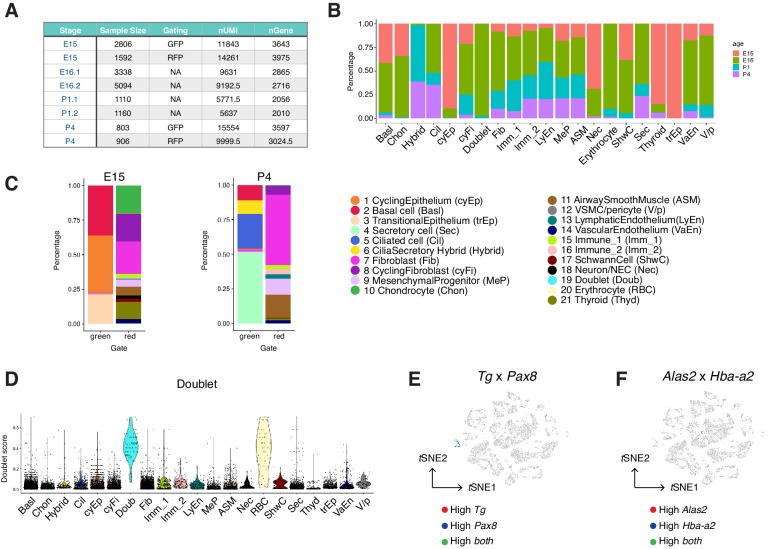
(A) A summary of cell numbers, gating of fluorescence-activated cell sorting (FACS, performed for E15 and P4 samples), median number of unique molecular identifiers (nUMI), and median number of genes (nGene) for each sample in the wild-type mouse trachea atlas presented in Figure 2. (B) Vertical bar graphs showing the proportion of cell types and states from each time point for each tracheal cell type and states colored by developmental stages. The overall representation of stromal cells from our atlas is consistent with those previously published lung atlas (Xie et al., 2018; Guo et al., 2019; Zepp et al., 2017) and reflects the diversity of cell types and states present in the developing airway. (C) The cellular composition of all cell types identified at E15 and P4. FACS was performed for cells from ShhCre/R26mTmG​ mice before RNA-sequencing to distinguish cells of the Shh-expressing lung endoderm lineage (green) from the rest non-endoderm lineages (red). In agreement with the established lineage relationships of the airway endoderm, GFP+ cells derived from ​Shh+ endoderm consistently expressed the epithelial marker Epcam. These ​Epcam+ cells were annotated as 1) basal cells, 2) ciliated cells, 3) secretory cells, and 4) cilia-secretory hybrid cells. RFP+ cells derived from non-Shh expressing lineages consisted of a large collection of mesenchymal cells, muscle cells, endothelial cells, immune cells, Schwann cells, and neuronal cells. Legends for cell types and cell states are shared in B and C D Doublet scores for all cells. Each dot represents a cell. Colors indicate cell clusters. (E) Expressions of thyroid markers ​Tg​ and ​Pax8​ projected onto ​tSNE​ shown in Figure 2B. (F) Expressions of erythrocyte markers ​Alas2​ and ​Hba-a2 ​projected onto ​t​SNE shown in Figure 2B. Our dataset comprises a collection of diverse mesenchymal cell types, many of which have not been characterized at single-cell resolution. Vascular smooth muscle cells and pericytes are identified based on the expression of ​Notch3​ and ​Rgs5​, whereas airway smooth muscle cells express higher levels of ​Myh11​ and Acta2.​ Endothelial cells express ​Pecam1​ and can be further grouped into lymphatic endothelial cells based on the expression of ​Lyve1​ and ​Thy1​, and vascular endothelial cells based on the expression of ​Cd34​. We identified two immune cell clusters, including a population of ​Fcerig+​/​Cd3g+ ​T cells and a population of ​Cx3cr1+​/​C1qa+​ monocytes. Our dataset includes a cluster of ​Wnt2+ ​mesenchymal cells which persist across all time points included in this study. These cells are marked by ​Pi16​, ​Cd34,​ and ​Ly6a​ (​Sca-1​), similar to the molecular signatures of adipose progenitor-like cells. Because ​ Wnt2+ lineages can serve as cardiopulmonary progenitors and define a mesenchymal alveolar niche important for self-renew and repair in the lung, we annotated this ​Wnt2+​/​Cd34+​/​ ​Ly6a+ ​​cluster as mesenchymal progenitors, which may generate the reservoirs of mesenchymal cell types during development and tissue repair.