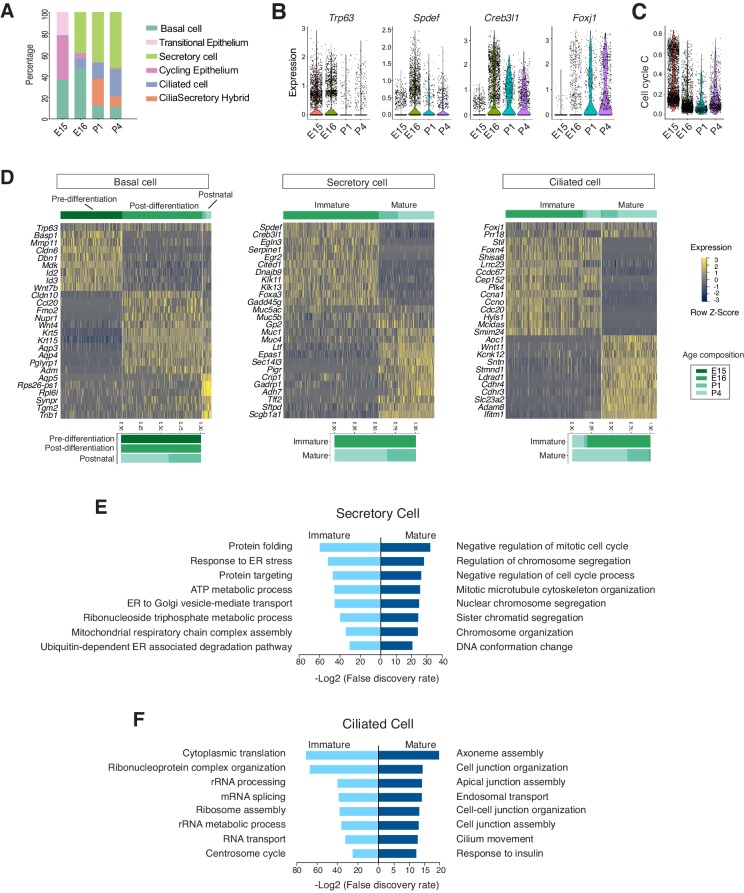
Figure 3. Developmental landscape of tracheal epithelial cells.
(A) Horizontal bar graphs showing the cellular composition of mouse tracheal epithelial cells from different developmental and neonatal time points. (B) Violin plots showing the expression of Trp63, Spdef, Creb3l1, and Foxj1 in epithelial cells at different developmental time points. Gene expression has been normalized and log-transformed. (C) scGPS showing cell-cycle gene expression in epithelial cells at different time points. scGPS (single-cell Geneset Percentile Score) is an expression enrichment analysis that utilizes sets of genes underlying certain biological and pathological processes to infer functional profiles for each cell. The cell cycle gene list can be found in Figure 3—source data 1. (D) Heat maps showing transcriptional profiles of tracheal basal, ciliated, and secretory cells across different developmental time points, with age compositions of corresponding cell states showed in horizontal bar plots. Gene expression has been normalized, log-transformed, and z-score transformed. Cell clusters are not predefined by developmental time-points. (E) Pathways enriched in immature and mature secretory cells revealed by gene ontology analysis. Selected top terms for biological process are shown. (F) Pathways enriched in immature and mature ciliated cells revealed by gene ontology analysis. Selected top terms for biological process are shown.


