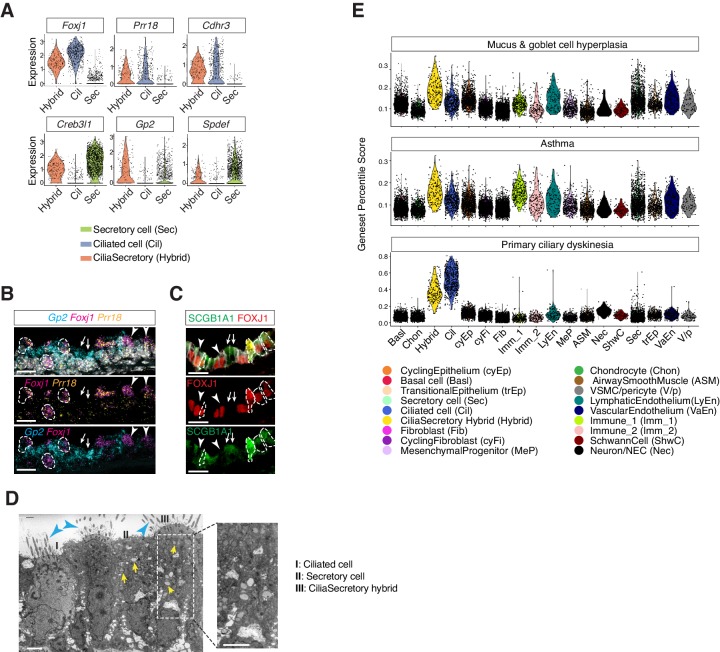
Figure 4. Characterization of neonatal cilia-secretory hybrid cells.
(A) Violin plots showing the expression levels of ciliated cell markers Foxj1, Prr18, and Cdhr3, as well as secretory cell markers Creb3l1, Spdef, and Gp2 in three cell clusters: ciliated cells, secretory cells, and cilia-secretory hybrids. Gene expression has been normalized and log-transformed. (B) RNA FISH analysis of Foxj1 (magenta), Gp2 (blue), and Prr18 (yellow) mRNA in P3 wild-type trachea. Hybrid cells expressing all three markers are indicated by dashed circles. Foxj1+ Prr18+ ciliated cells are indicated by arrowheads. Gp2+ secretory cells are indicated by arrows. Nuclei are marked by DAPI (grey). Scale bar indicates 20 μm. (C) Fluorescent immunostaining of FOXJ1 (red) and SCGB1A1 (red) in P3 wild-type trachea. Hybrid cells expressing both markers are indicated by dashed circles. FOXJ1+ ciliated cells are indicated by arrowheads. SCGB1A1+ secretory cells are indicated by arrows. Cell membranes are marked by E-cadherin (grey). Scale bar indicates 20 μm. (D) Transmission electron microscopy (TEM) images of P0 tracheal epithelial cells. Intracellular vesicles are indicated by arrows in yellow. Motile cilia are indicated by arrowheads in blue. Scale bar corresponds to 2 μm. (E) scGPS of disease-associated genes curated from the Online Mendelian Inheritance in Man (OMIM) database. Each dot represents a cell. Colors indicate cell clusters. Full lists of genes used are in Figure 4—source data 1.


