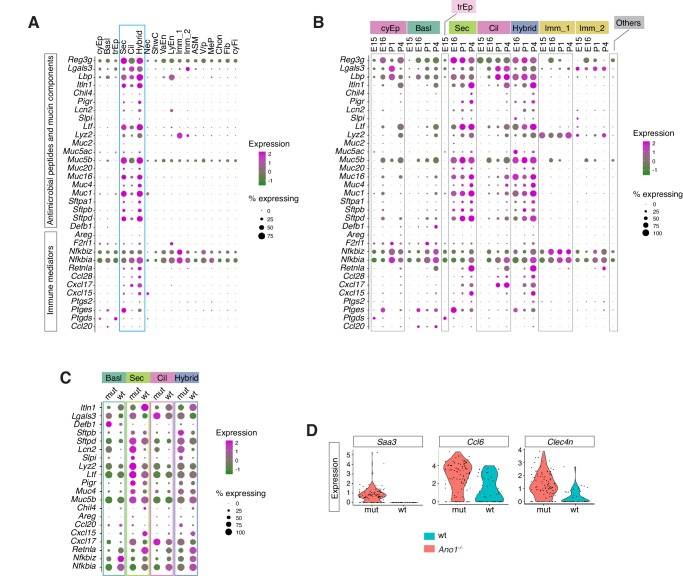
Figure 5. Ano1 KOs exhibit abnormal immune profiles of the airway mucosal barrier.
(A) Dot plot showing the expression of mucosal barrier regulators and immune mediators. Legends for cell types are indicated. The size of the dot encodes the percentage of cells expressing the gene, while the color encodes the mean of expression level which has been normalized, log-transformed, and z-score transformed. (B) Dot plot showing the temporal expression of airway barrier genes. The size of the dot encodes the percentage of cells expressing the gene, while the color encodes the mean expression level after normalization, log-transformation, and z-score transformation. cyEp: Cyling epithelium, Basl: Basal cells, trEp: Transitonal epithelium, Sec: Secretory cells, Cil: Ciliated cells, Hybrid: Cilia-Secretory hybrid cells, Imm_1: Fcer1g+/Cd3g+ immune cells, Imm_2: Cx3cr1+/C1qa+ immune cells, Others: all other cell types and states (C) Expression of selected airway barrier genes altered in Ano1-/- mutant epithelial cells at P4. The size of the dot encodes the percentage of cells expressing the gene, while the color encodes the mean of expression level which has been normalized, log-transformed, and z-score transformed. Cell type legends for A and B are shown in the figure. (D) Violin plots showing the expression levels of Saa3, Ccl6, and Clec4n in the Fcer1g+ resident immune cells. Gene expression has been normalized and log-transformed.


