. 2020 Apr 14;9:e53085. doi: 10.7554/eLife.53085

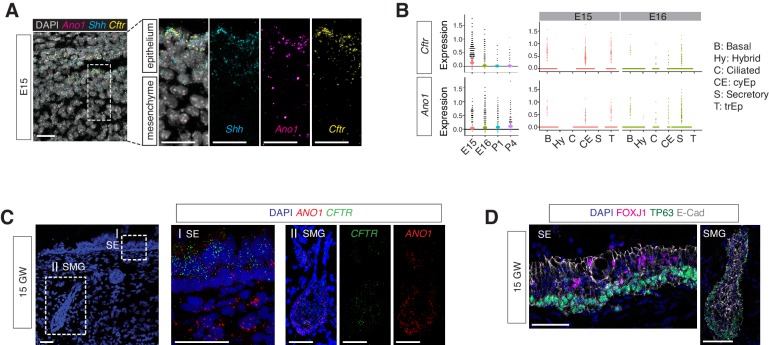
Figure 6. ​ Expressions of ​Ano1 and ​Cftr​ in embryonic and fetal airways.

(A) ​Expression of ​Shh,​ ​Cftr,​ and ​Ano1 ​in E15 trachea examined by FISH.​ Shh ​marks tracheal epithelial cells. Nuclei are stained by DAPI (white). Scale bar indicates 20 ​μ​m. (B) Expression of ​Cftr​ and ​Ano1​ in tracheal epithelial cells at different time points, with a cell type breakdown for E15 and E16. Expressions of Cftr​ and ​Ano1​ in neonatal tracheal epithelial cells are shown in Figure 6—figure supplement 1. (C) Expression of ​CFTR​ and ​ANO1 ​in human fetal trachea of GW 15 by FISH. Two areas (I: surface epithelium/SE; II: submucosal glands/SMG) of the fetal tracheal epithelium are enlarged. Nuclei are stained by DAPI (blue). Scale bar indicates 50 ​μ​m. (D) Immunofluorescence staining of ​TP63​ (green) and ​FOXJ1​ (magenta) in human fetal tracheal sample at GW 15. SE and SMG are shown. Ciliated cells are only present in the surface epithelial cell layer. Epithelial cells are marked by E-cad in white. Nuclei are stained by DAPI (blue). Scale bar indicates 50 ​μ​m.

Figure 6.

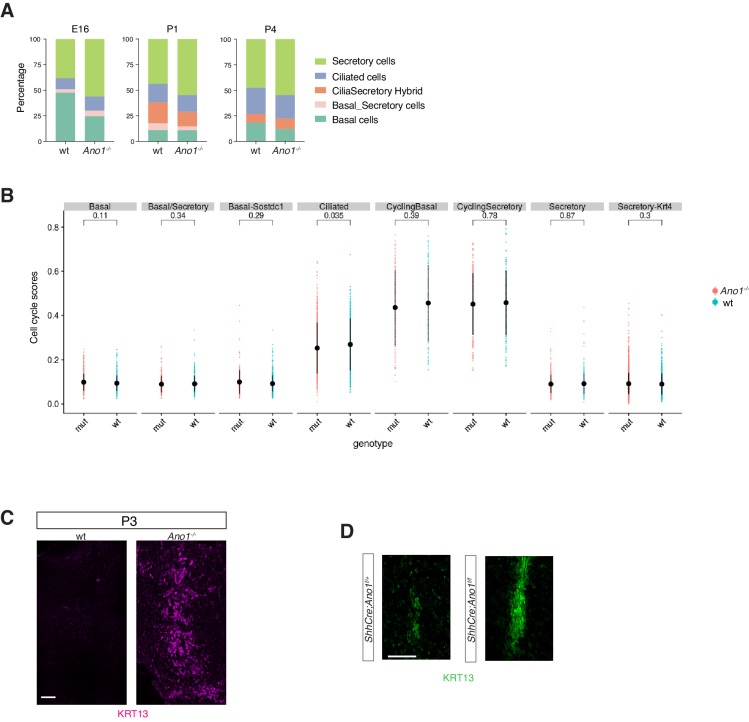
Figure 6—figure supplement 1. Expansion of the secretory cell lineage in global and conditional Ano1 knockouts.

Figure 6—figure supplement 1.

(A) ​Cellular composition for tracheal epithelial cells of wild-type littermates and Ano1-/- mutants from different time points. (B) scGPS showing cell-cycle gene expression in every epithelial cell state at E16 in wild-type and Ano1-/- mutant embryos. scGPS (single-cell Geneset Percentile Score) is an expression enrichment analysis that utilizes sets of genes underlying certain biological and pathological processes to infer functional profiles for each cell. Adjusted p-values for the comparison within each cell type (unpaired two-tailed wilcoxon-test between wild-type and mutant) are indicated. (C) Immunofluorescent staining of KRT13 (magenta) in wild-type and ​ Ano1-/- trachea at P3. Scale bar represents 100 μm. (D) Immunofluorescent staining of KRT13 (green) in adult ​ShhCre; Ano1flox/- a​nd​ ShhCre; Ano1flox/flox conditional knockouts. n = 4 were analyzed. Scale bar indicates 50​ μ​m.