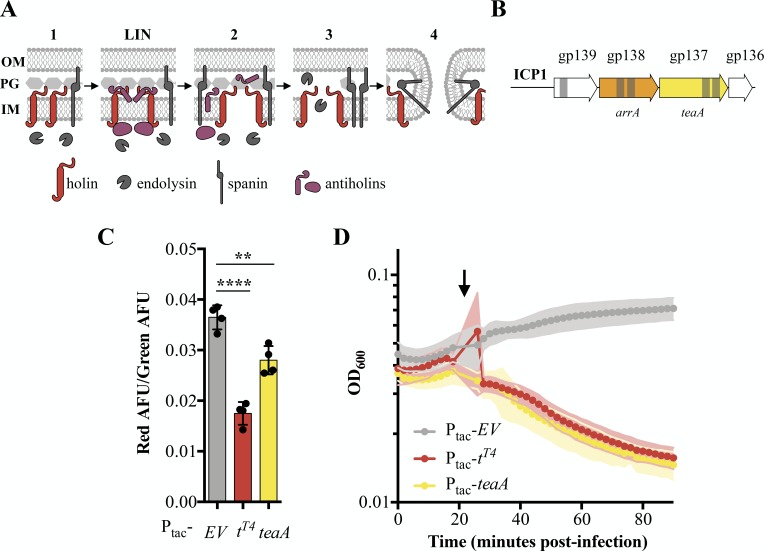
Figure 2. Identification and characterization of ICP1’s holin TeaA.
(A) Schematic of canonical T4 lysis in E. coli. Lysis occurs in four steps with a potential delay caused by lysis inhibition. Step one: Phage encoded proteins including holins, endolysins, and spanins accumulate in the cell. In the event of superinfection, antiholins halt the lysis program causing lysis inhibition (LIN). Step two: Holins are triggered collapsing the proton motive force and forming holes in the inner membrane (IM) releasing endolysins to the periplasm. Step three: The peptidoglycan (PG) is degraded by endolysins. Step four: Spanins fuse the inner and outer membrane (OM). (B) Transmembrane domains (grey bars) were predicted in three gene products (gp) in a conserved locus of ICP1. (C) Relative state of the proton motive force as measured by the ratio of red to green arbitrary fluorescence units (AFU) from DiOC2(3) after ectopic gene expression. Points represent individual replicates; bar height is the average; error bars display the standard deviation of samples. Significance was calculated via one-way ANOVA followed by Dunnett’s test. ****p≤0.0001; **p≤0.01. (D) Chemical triggering with 2,4-dinitrophenol (arrow) after ectopic gene expression as measured by optical density (OD600). Points show the average of four replicates; shading shows the standard deviation.

