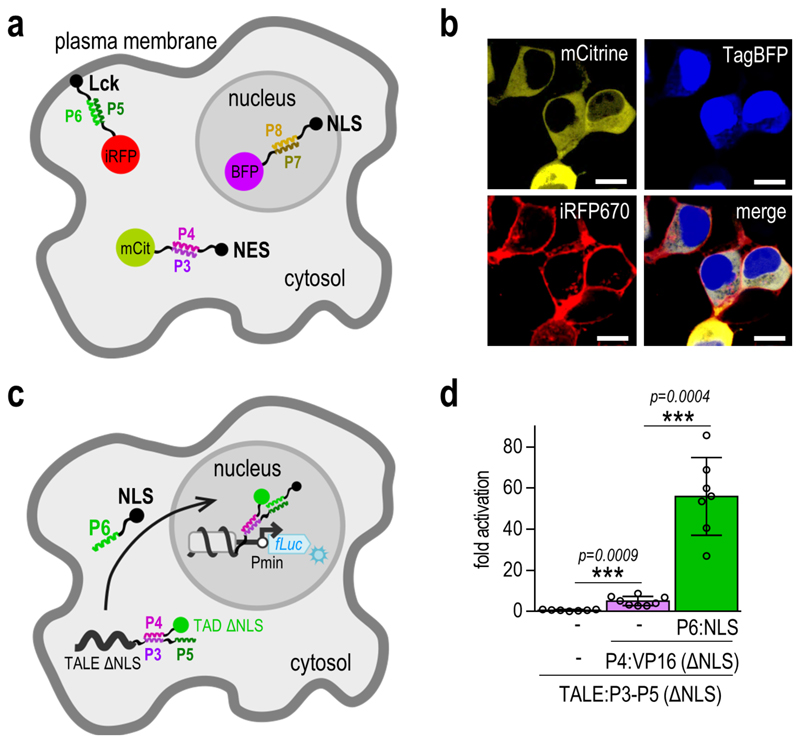
Figure 2. CC-directed localization of multiple proteins.
(a) Schematic presentation of the directed localization of fluorescent reporter proteins upon addition of the corresponding CC peptide fusions. ‘mCit’, ‘BFP’ and ‘iRFP’ represent the mCitrine, TagBFP and iRFP670 fluorescent proteins, respectively. ‘NLS’ represents the nuclear localization signal, ‘NES’ the nuclear export signal and ‘Lck’ the Lck membrane localization signal. (b) Experimental evaluation of fluorescent protein localization. HEK293T cells were co-transfected with 25 ng of each fluorescent reporter-CC encoding plasmid, and 125 ng of each of the plasmids encoding the corresponding CC peptides, fused to different localization signals. Images are representative of two independent experiments. Scale bar = 10 µm. (c) Schematic presentation of the expected localization of the NLS deficient TALE:CC-CC:TAD complex. Upon addition of the P6:NLS fusion peptide, the complex is brought to the nucleus, where it triggers activation of reporter gene transcription. ‘Pmin’ represents the minimal promoter and ‘fLuc’ the firefly luciferase reporter gene. (d) The NLS deficient TALE:CC-CC:TAD complex activates transcription of the reporter gene only upon co-transfection of the P6:NLS fusion peptide. HEK293T cells were co-transfected with 50 ng of the [a]10_Pmin-fLuc reporter plasmid, 25 ng of the TALE:CC(ΔNLS) encoding plasmid, 10 ng of the CC:VP16(ΔNLS) encoding plasmid and 25ng of the CC:NLS encoding plasmid. Replicates represent HEK293T cell cultures, individually transfected with the same mixture of plasmids. The values represent the mean and standard deviation of replicates within two independent experiments (n = 4). Fold activation was calculated by normalizing the RLU values of each sample to the RLU value of the reporter only control within the same experiment. Statistical analysis was performed on pooled data from both experiments by the two-sample F-test and the two-tailed two-sample t-test assuming equal or unequal variances as determined by the F-test. The p-values are indicated above the bars.

