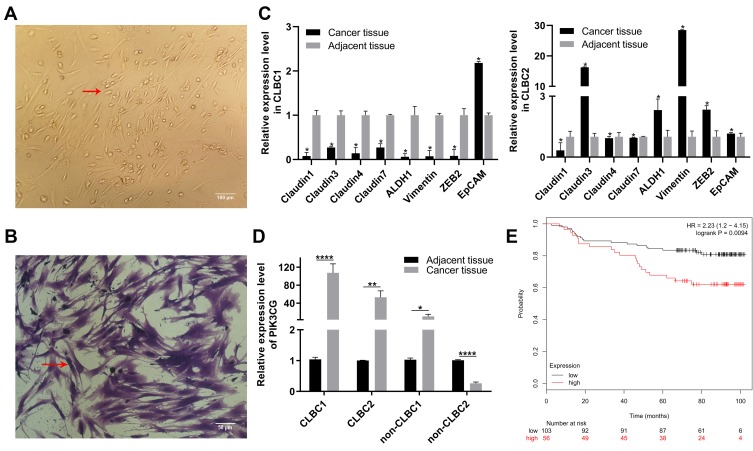
Figure 1.
PIK3CG was a potentially therapeutic target. (A) Images of CLBC patients’ cells in 2D culture. Red arrow indicates single CLBC cell. (B) CLBC patients’ cells were stained with crystal violet. Red arrow indicates single CLBC cell. (C) Relative expression of Claudin1, Claudin3, Claudin4, Claudin7, EpCAM, ALDH1, Vimentin and ZEB in CLBC1 and CLBC2 by qPCR. (D) Relative expression of PIK3CG in CLBC1, CLBC2, Non-CLBC1 and Non-CLBC2 by qPCR. (E) The correlation of PIK3CG expression level and survival rate of patients with breast cancer by the analysis of GSE1456. *P<0.05, **P<0.005, ****P<0.00001.

