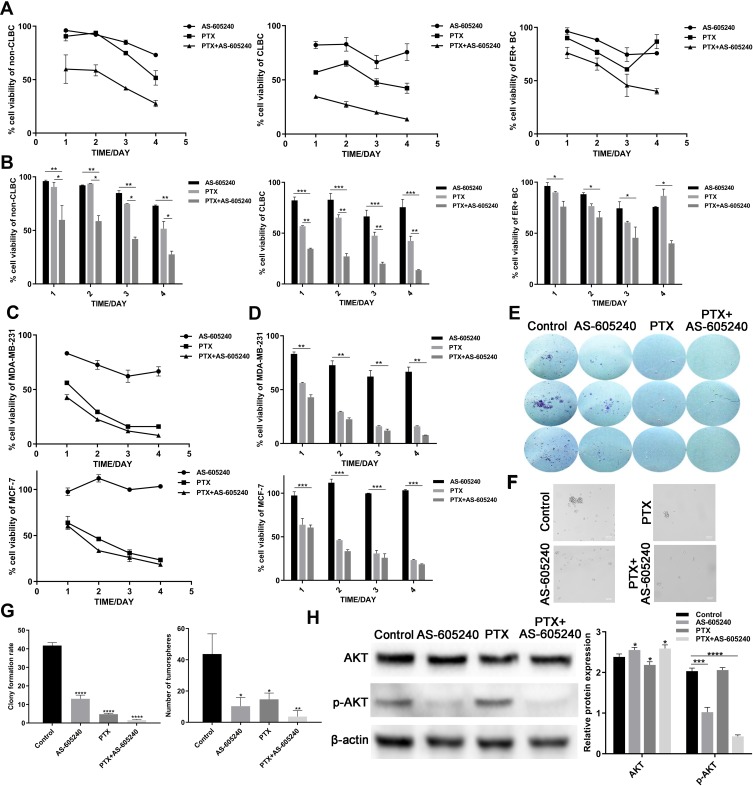
Figure 2.
The growth of CLBC cells were treated with drugs in 2D and 3D cultures. (A) Growth curve of Non-CLBC, CLBC and ER+ cells treated with AS-605240 (6μM) and/or PTX (1μM) for 24, 48, 72 and 96 hours by CCK8 experiments. (B) Cell viability rate of the 3 above primary culture cells was calculated depending on growth curve. (C) Growth curve of MDA-MB-231 and MCF-7 cells treated with AS-605240 (6μM) and/or PTX (1μM) for 24, 48, 72 and 96 hours by CCK8 experiments. (D) Cell viability rate of the MDA-MB-231 and MCF-7 cells was calculated depending on growth curve. (E) Colony-forming assay for MDA-MB-231 cells after 14 days of continuous treatment with AS-605240 (6μM) and/or PTX (1μM). DMSO treatment was used as the control group. (F) Representative photomicrographs of tumorspheres formed by MDA-MB-231 cells with continuous treatment with AS-605240 (6μM) and/or PTX (1μM) for 2 weeks in 3D cultures. DMSO treatment was used as the control group. (G) The rate of clone formed per 500 cells and quantification of tumorspheres formed per 20,000 cells depending on E and F. (H) Analysis of total AKT and p-AKT protein levels by Western blot using MDA-MB-231 cells treatment with AS-605240 (6μM) and/or PTX (1μM). DMSO treatment was used as the control group. Bars represent the mean ± S.E. of protein levels, normalized by β-actin expression levels. * P<0.05, ** P<0.005, ***P<0.0005, ****P<0.00001.

