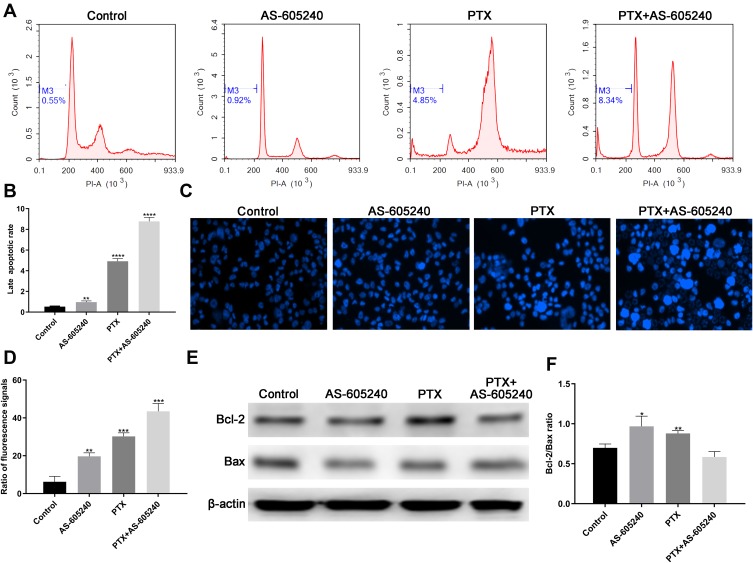
Figure 3.
The apoptotic rate of CLBC cells were treated with drugs. (A) MDA-MB-231 cells treated with AS-605240 (6μM) and/or PTX (1μM) and late stage apoptosis was checked by flow cytometry. DMSO treatment was used as the control group. (B) The late apoptotic rate was statistically analyzed depending on A. (C) MDA-MB-231 cells treated with AS-605240 (6μM) and/or PTX (1μM) and then stained by Hoechst 33342 (D) Column diagram indicating the ratio fluorescence signals per high power microscope field and the statistical analysis results depending on C. (E) Western blot analysis of Bcl-2 and Bax using MDA-MB-231 cells treatment with AS-605240 (6μM) and/or PTX (1μM). DMSO treatment was used as the control group. (F) Analysis of Bax/Bcl-2 ratio by the ImageJ software depending on E. Bars represent the mean ± S.E. of Bax/Bcl-2 ratio. * P<0.05, ** P<0.005, ***P<0.0005, ****P<0.00001.

