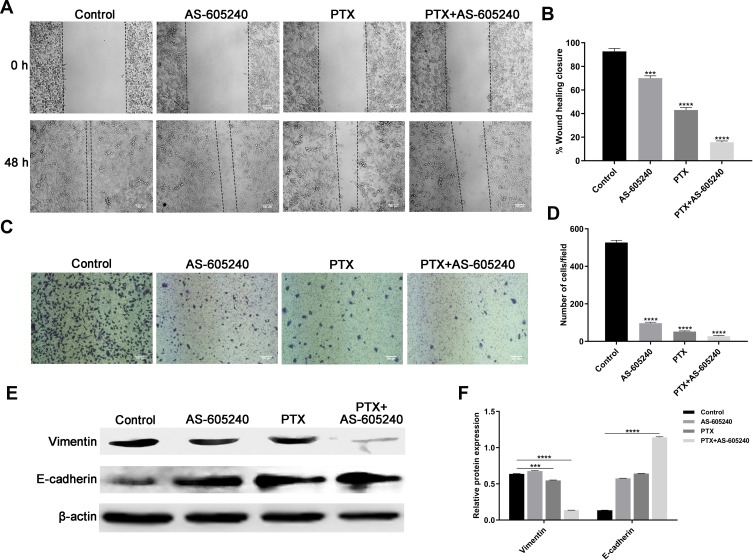
Figure 4.
The migration of CLBC cells were treated with drugs. (A) Representative images of wound-healing assay. MDA-MB-231 cells were incubated with AS-605240 (6μM) and/or PTX (1μM) or DMSO as control. (B) Statistical analysis of wound-healing closure depending on A. (C) Representative images of transwell assay. MDA-MB-231 cells were treated with AS-605240 (6μM) and/or PTX (1μM) or DMSO as control. (D) Statistical analysis of invading cell counts per high power microscope field. (E) Western blot analysis of Vimentin and E-cadherin using MDA-MB-231 cells treatment with AS-605240 (6μM) and/or PTX (1μM). (F) Analysis of relative protein expression depending on E. Bars represent the mean ± S.E. of protein levels, normalized by β-actin expression levels. ***P<0.0005, ****P<0.00001.

