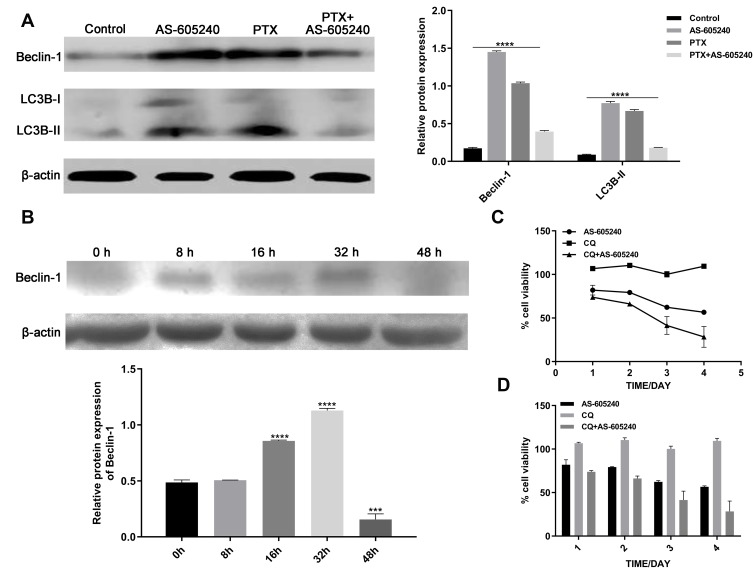
Figure 5.
The Autophagy of CLBC cells were treated with drugs. (A) Analysis of Beclin-1 and LC3B protein levels by Western blot using MDA-MB-231 cells treatment with AS-605240 (6μM) and/or PTX (1μM) or DMSO as control for 48 hours. Bars represent the mean ± S.E. of protein levels, normalized by β-actin expression levels. (B) Analysis of Beclin-1 protein levels at different time points in MDA-MB-231 cells were induced by AS-605240 (6μM) combined with PTX (1μM). Bars represent the mean ± S.E. of protein levels, normalized by β-actin expression levels. (C) Growth curve was determined by cck-8 when MDA-MB-231 cells were treated with AS-605240 (6μM) and/or chloroquine (1μM) for 24, 48, 72 and 96 hours. (D) Column graph for the rate of cell viability was described depending on growth curve. ***P<0.0005, ****P<0.00001.

