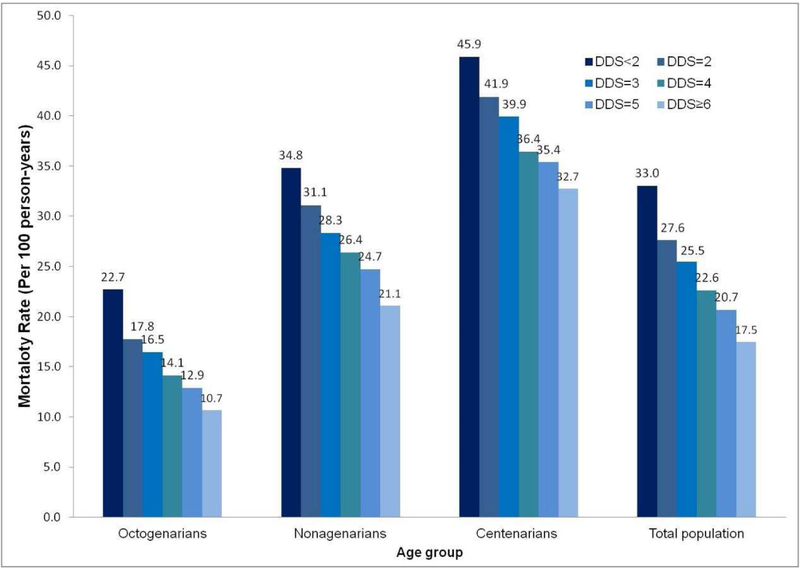
Figure 2. Mortality rate (person-years) in participants with different dietary diversity scores.
For the whole cohort, the mortality rate was 21.2 per 100 person-years, and 33.0, 27.6, 25.4, 22.6, 20.7, and 17.5 per 100 person-years for participants with less than 2, 2, 3, 4, 5, and ≥6 points of DDS.

