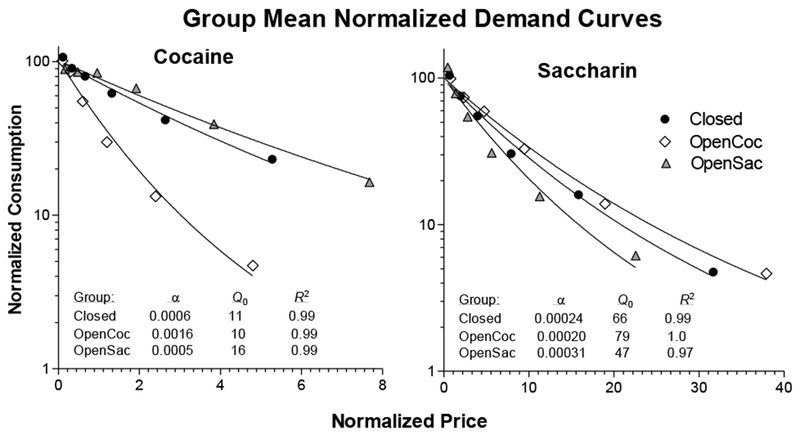
Figure 2.

Normalized demand curves fit by Hursh and Silberberg’s (2008) exponential demand model to group mean cocaine (left panel) and saccharin (right panel) data. Consumption is expressed as a percentage of Q0, the expected amount consumed as price approaches 0. Price is expressed as the number of responses required at a particular FR value to produce 1% of Q0 [that is, normalized price = (FR x Q0)/100]. The inset tables present values of α, Q0, and R2 for fits of the model to the non-normalized data.
