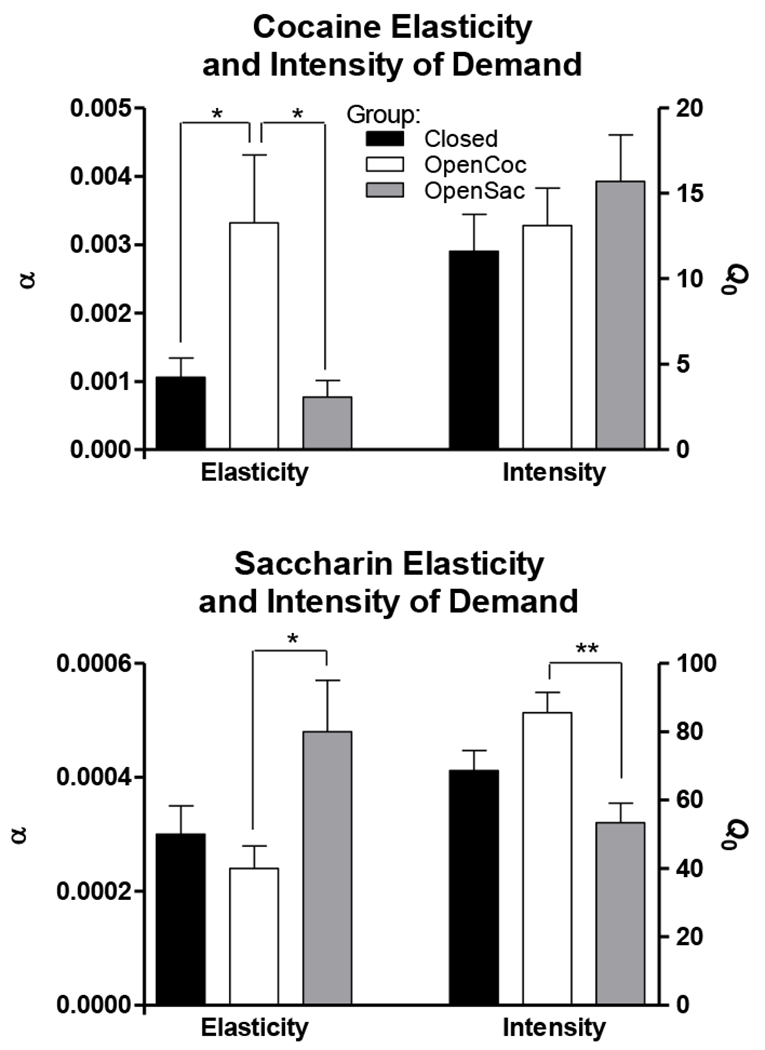
Figure 3.

Mean (± SEM) values of α and Q0 derived from fits of the exponential demand model to individual subjects’ consumption data. The upper and lower panels present these estimates for cocaine and saccharin, respectively, for each of the three groups. * indicates p < 0.05 ** indicates p < 0.01
