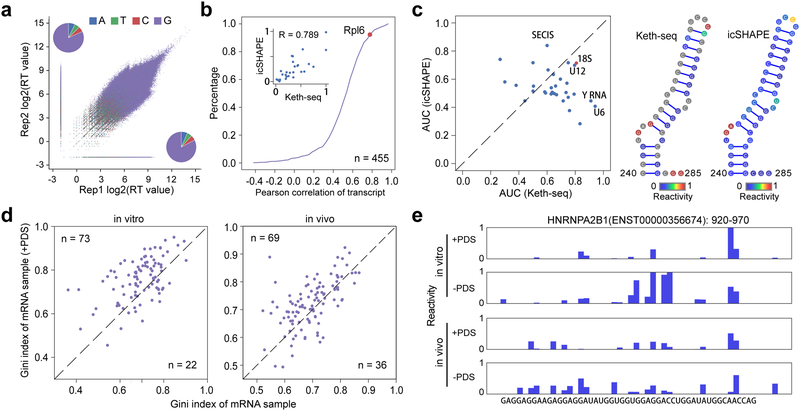
Figure 2 |. Keth-seq method and the profile around rG4 regions.
(a) Scatter plot of reverse transcription (RT) stop reads distribution between replicates for N3-kethoxal sample. The inset pie plots show RT stopped base distribution for replicate 2 (upper left, A: 604,222; T: 497,602; C: 481,596; G: 7,204,998) and replicate 1 (bottom right, A: 703,486; T: 586,297; C: 551,962; G: 8,683,824). (b) Accumulation plot of correlation coefficient between Keth-seq and icSHAPE for all transcript. For each common transcript, we calculate the Pearson correlation coefficient for structural signal of guanine bases. The inset plot shows all guanine reactivity between Keth-seq and icSHAPE for Rpl6 (a gene encoding ribosomal protein) transcript with a high correlation (Pearson correlation coefficient R: 0.789). (c) Left: scatter plot of AUC between Keth-seq and icSHAPE for RNAs with known structure model (18S ribosomal RNA from RNA STRAND database and others from Rfam database, 32 RNAs in total). Right: A fragment (240–285) of 18S ribosomal RNA with both Keth-seq and icSHAPE reactivity filled in the structure model. (d) Gini index of known rG4 regions (based on previously identified by Kwok et.al., 2016, Nature method) between +PDS treatment and native sample for in vitro (left) and in vivo (right). Only regions with structural information in both + PDS treatment and native conditions are retained for plotting (extended to 50-nucleotide long). (e) An example of Keth-seq profile around previously identified in vitro rG4 regions.

