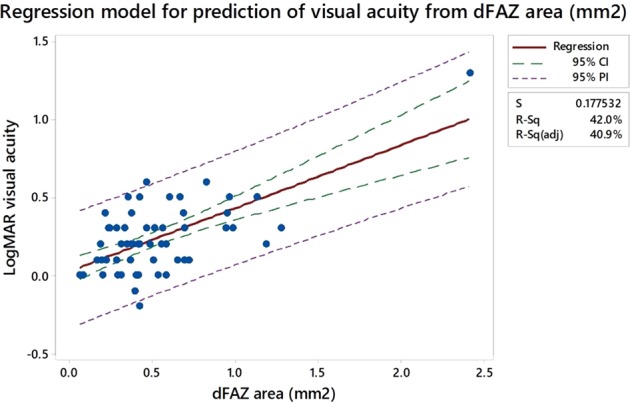
Fig. 3.

Regression model for prediction of visual acuity from dFAZ area (mm2). On the fitted line plot, the 95% confidence (CI) and 95% prediction intervals (PI) are displayed as dashed lines identifying the upper and lower limits of the intervals. The confidence interval represents a range of likely values for the mean response. The prediction interval represents a range of value for a single new observation and is wider as predicting a single response value is less certain. S represents the standard error of the regression, the average distance that the observed values fall from the regression line
