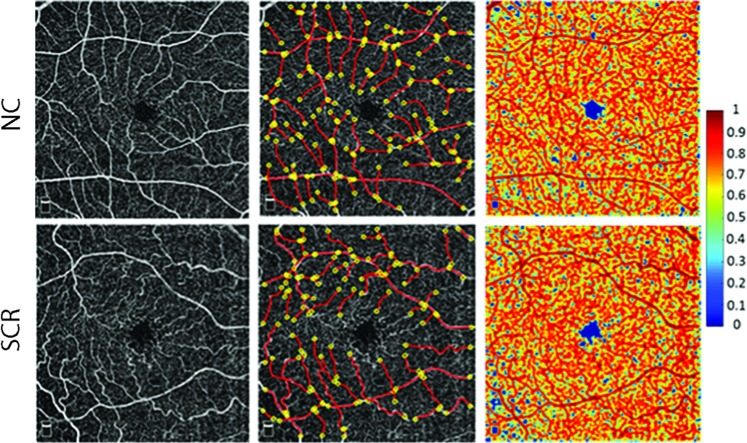
Fig. 1.
(Left) OCTA images in a 6 × 6 mm retinal superficial capillary plexus acquired in healthy control (NC) (top) and sickle cell retinopathy (SCR) subjects (bottom). (Middle) Vessel endpoints (yellow circles) and centrelines (red lines) used for vessel tortuosity measurements are overlaid on OCTA images in the same NC and SCR subjects. (Right) Fractal dimension ratio (FDR) images in the same NC and SCR subjects. The colour bar shows FDR values ranging from 0 to 1

