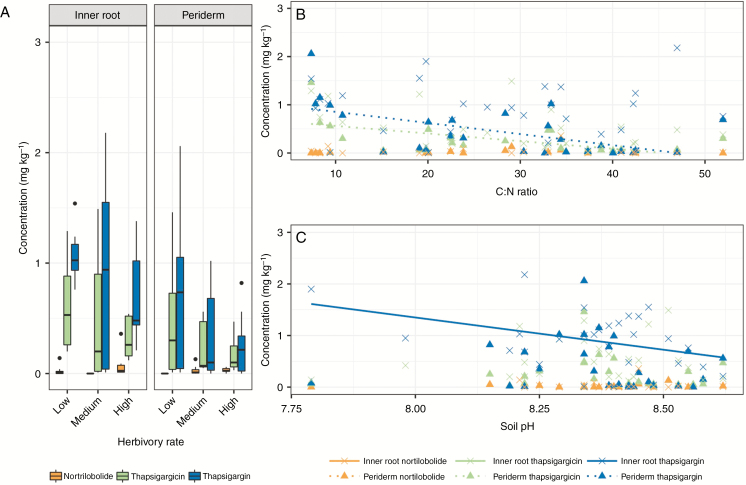
Fig. 4.
Relative distribution of thapsigargin, thapsigargicin and nortrilobolide in inner roots and root periderms of Thapsia garganica (A) across the herbivory gradient, (B) with changing C:N ratio and (C) with changing soil pH. Lines of best fit are drawn with significant interactions. The C:N ratio was significantly correlated with thapsigargin and thapsigargicin in the root periderm, and soil pH was significantly correlated with thapsigargin in the inner root. Note that for Fig. 4 only, a single sample has been excluded as it contained exceptionally high thapsigargin concentrations (5.8 mg kg−1 of thapsigargin and 8.0 mg kg−1 of thapsigargicin).

