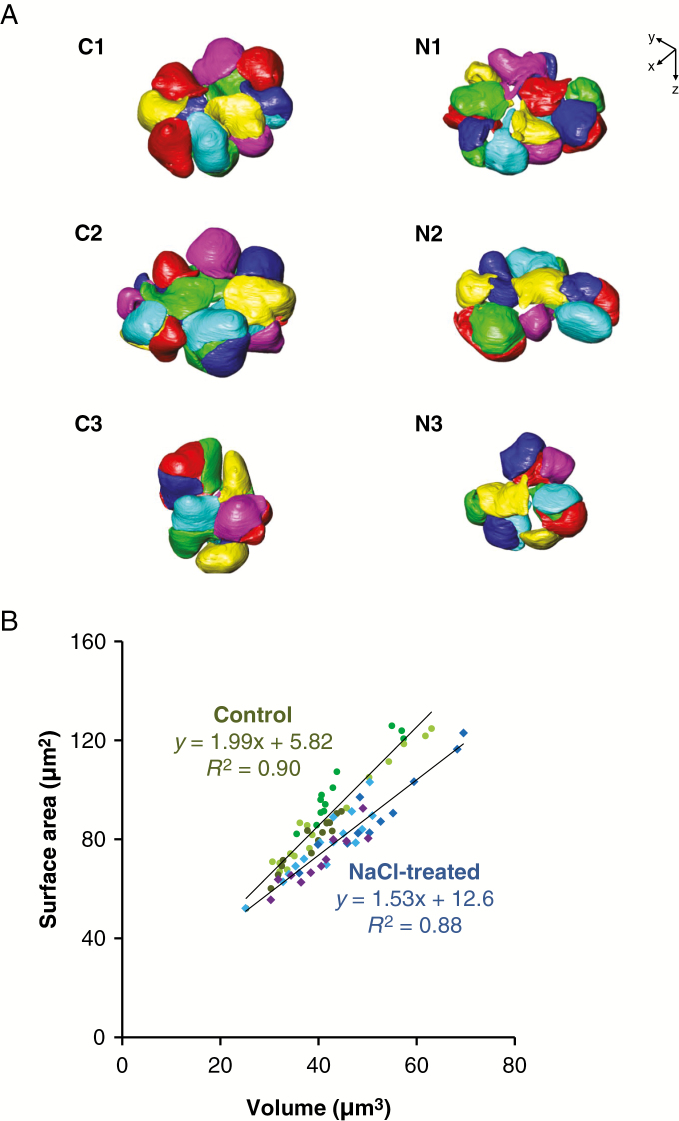
Fig. 4.
The 3-D models of the chloroplasts in the rice mesophyll cells in the control (C1–C3) and NaCl-treated (N1–N3) plants. (A) 3-D surface modelling of the chloroplasts shows their configuration in the mesophyll cells, as shown in Fig. 3. Each chloroplast is presented in one colour, and six colours are used to distinguish the neighbouring chloroplasts. The number of chloroplasts contained in each cell was: 13 (C1), 17 (C2), 14 (C3), 15 (N1), 11 (N2) and 11 (N3). (B) Relationship between volume and surface area of the chloroplasts presented. Circles, control (n = 44); squares, NaCl treated (n = 37). Each symbol with the same colour belongs to the same cell.

