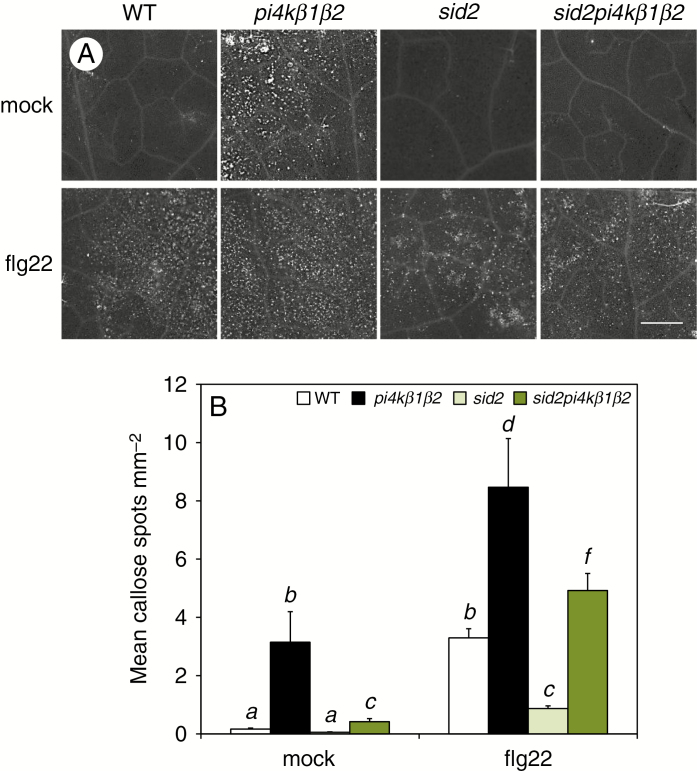
Fig. 4.
Callose deposition in response to flagellin. (A) Representative images of callose accumulated in leaves of 4-week-old A. thaliana plants by aniline blue staining, 24 h after infiltration with 0.1 µm flg22 or mock infiltration. Scale bar = 1cm. (B) Quantification of callose particles. Values represent an average of five ROI. Data are presented as means +s.d. For each treatment, statistical differences between the genotypes were assessed using a one-way ANOVA, with a Tukey honestly significant difference (HSD) multiple mean comparison post hoc test. Different letters indicate a significant difference, Tukey HSD, P < 0.01, n = 4.

