Fig. 2.
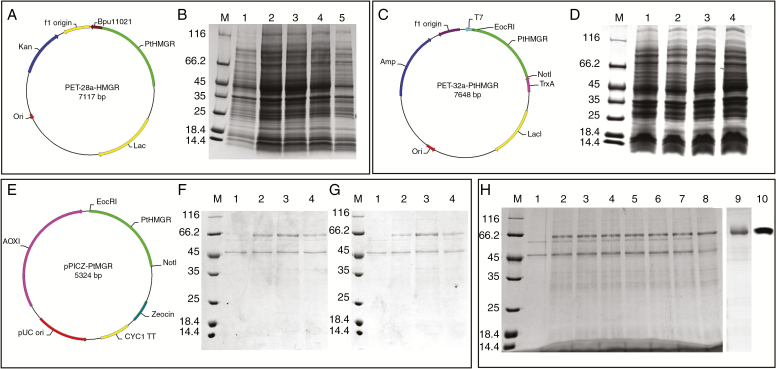
PtHMGR protein production and purification. (A) Construction of the PET-28a fusion vector containing PtHMGR and BamHI and NotI sites. (B) Analysis of PET-28a-HMGR expression by 12 % SDS–PAGE. Lane M, molecular mass marker; lane 1, negative control; lanes 2–5, colonies 1–4, respectively, induced by 1 mm IPTG. (C) Construction of the PET-32a fusion vector containing PtHMGR and BamHI and NotI sites. (D) Analysis of PET-28a-HMGR expression by 12 % SDS–PAGE. Lane M, molecular mass marker; lane 1, negative control; lanes 2–4, colonies 1–3, respectively, induced by 1 mm IPTG. (E) Construction of the pPICZ-α fusion vector containing PtHMGR and BamHI and NotI sites. (F) Analysis of methanol-induced pPICZ-α-HMGR expression. Lane M, molecular mass marker; lane 1, negative control; lane 2, 0.5 % methanol for 48 h; lane 3, 1 % methanol for 48 h; lane 4, 2 % methanol for 48 h. (G) Analysis of methanol-induced pPICZ-α-HMGR expression. Lane M, molecular mass marker; lane 1, negative control; lane 2, 1 % methanol for 48 h; lane 3, 1 % methanol for 72 h; lane 4, 1 % methanol for 96 h. (H) Analysis of the expressed fusion protein by 12 % SDS–PAGE. Lane M, molecular mass marker; lane 1, negative control; lanes 2–8, colonies 1–7, respectively, induced by 1 % methanol for 72 h; lane 9, purified PtHMGR; lane 10, identification of PtHMGR by western blotting.

