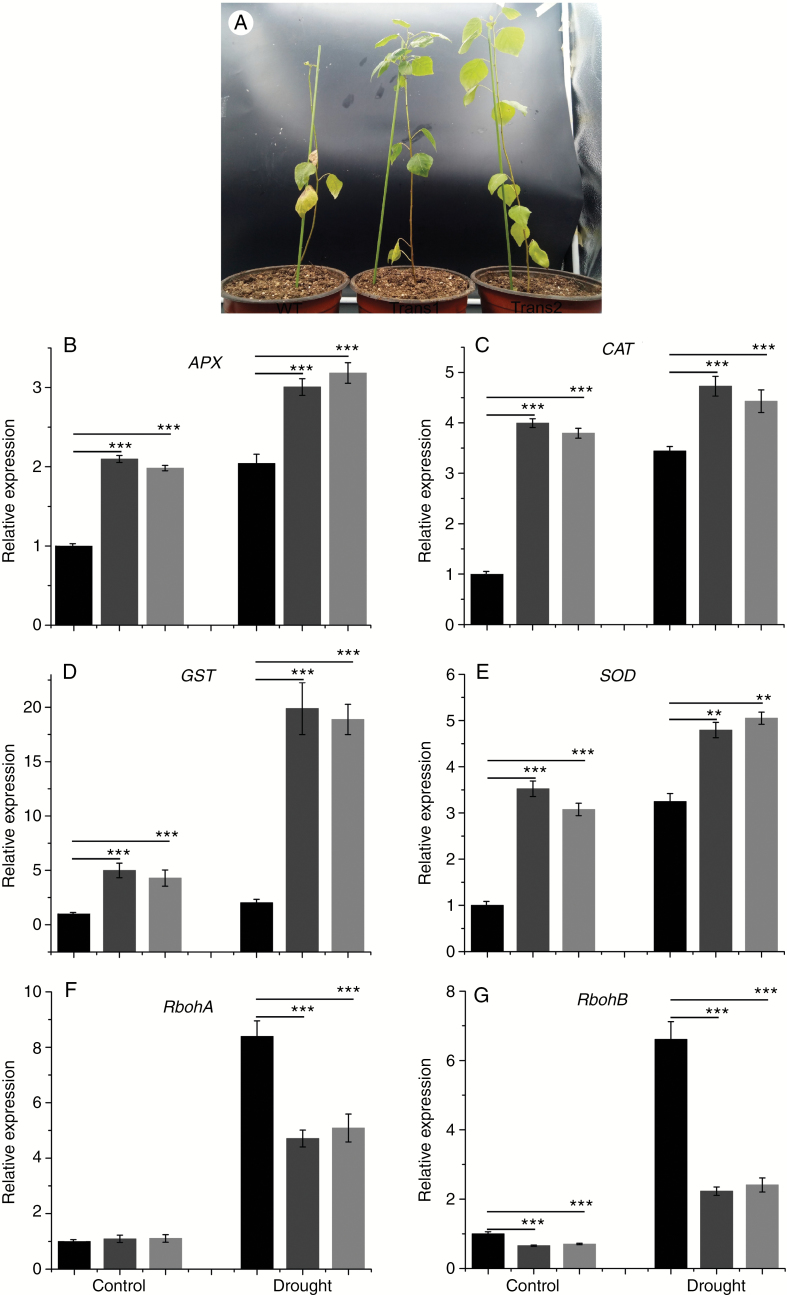
Fig. 9.
Effect of drought stress on the (A) phenotype and transcript levels of (B) APX, (C) CAT, (D) GST, (E) SOD, (F) RbohA and (G) RbohB in WT and transgenic poplar. Relative expression was calculated using Actin as an internal reference. WT leaves untreated with drought stress served as controls. Vertical bars are mean ± s.d. (n = 3). Black columns, WT; Trans1 and Trans2 represent two relatively independent transgenic lines, respectively, dark grey columns, Trans1; light grey columns, Trans2. Three independent experiments were performed. **P < 0.01, ***P < 0.001.

