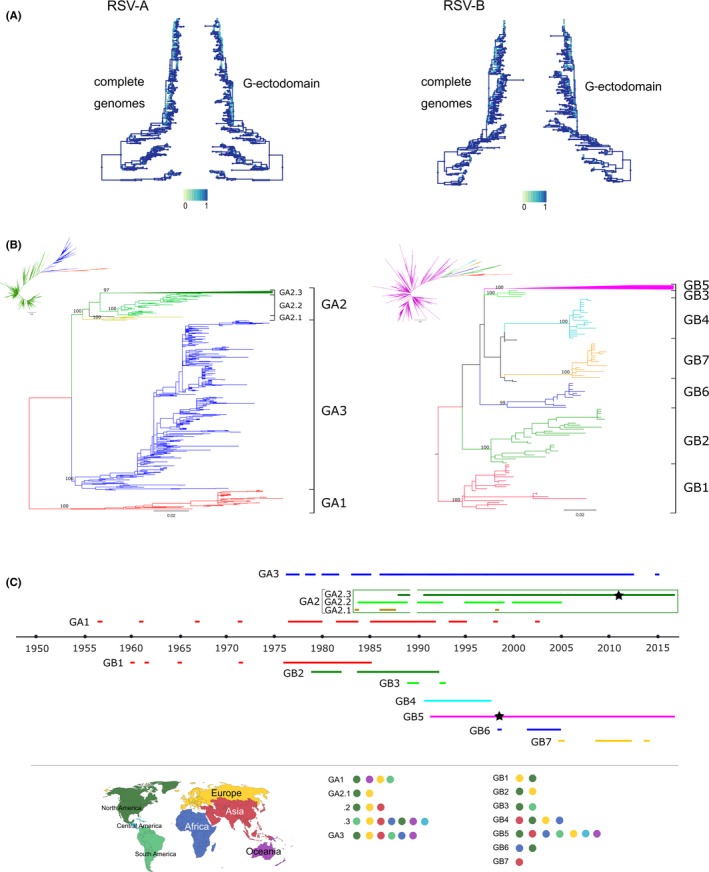
Figure 2.

Genotypes definition with G‐ectodomain region. A, Comparison of tree backbones. Trees were constructed from an alignment of complete genome sequences per subgroup. Branches are colored according to each node's similarity to its best corresponding node in the opposite tree. In the scale, 0 means non‐similarity and 1 means exact matching. B, Maximum likelihood trees for RSV‐A and B with G‐ectodomain sequence alignments (see the Section Methods for details). Colors in branches represent genotypes and subgenotypes. Subgenotype GA2.3 and genotype GB5 are collapsed in the rectangular trees. Complete uncollapsed trees are shown in the radial tree small figure next to each rectangular tree. UF bootstrap values of genotypes and subgenotypes nodes are shown. C, Timeline of detection of the identified genotypes and subgenotypes. Colored lines show the years of detection of a given genotype or subgenotype. Stars in lines of GA2 and GB5 genotypes show the year where strains with duplication in the 2nd hypervariable region of G gene were detected (72nt in RSV‐A and 60nt in RSV‐B). Geographical location of genotypes in order of detection is also shown
