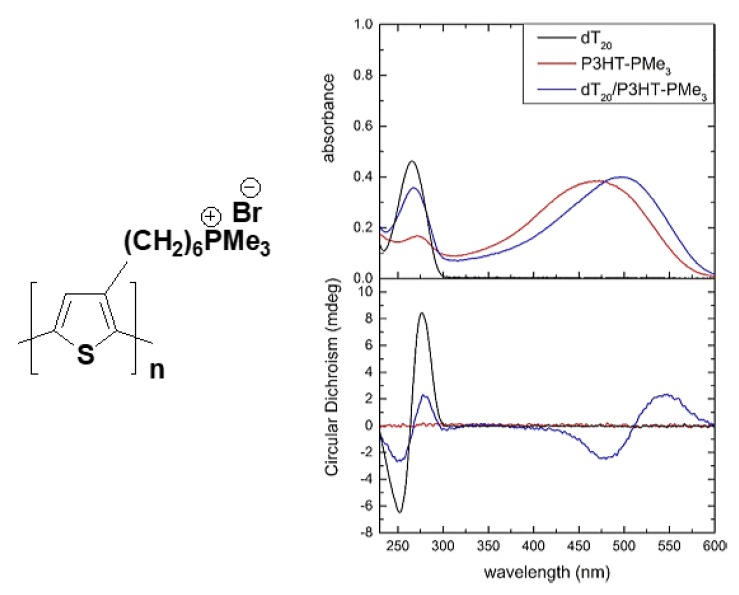
Figure 11.
Chemical structure of the cationic (P3HT-PMe3) (left) and UV-Vis and CD spectra of dT20 (black line), P3HT-PMe3 (red line) and dT20(oligonucletide)/P3HT-PMe3 complex (blue line) at a 1:1 DNA/polymer charge ratio. Reproduced with permission [86].

