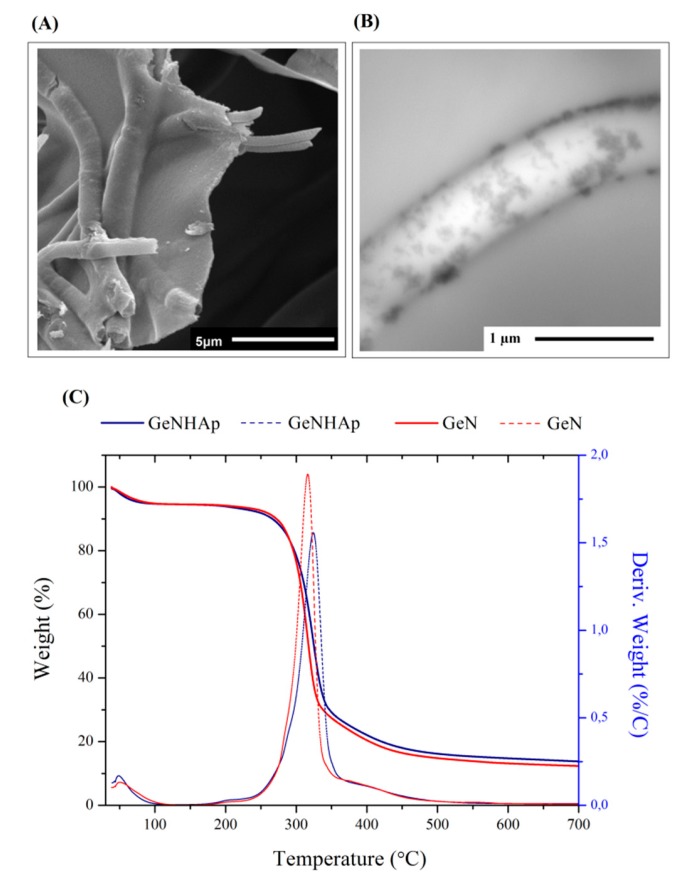
Figure 3.
Analysis of fibers covered with HAp (GeNHAp). (A) SEM image presenting PLGA fibers embedded in the walls of freeze-dried Ge; (B) TEM image of a single fiber covered with HAp and embedded in freeze-dried gelatin solution; (C) thermogravimetric curves of the GeN and GeNHap samples. The data show the differences in the thermal behavior of each type of sample and determine the HAp amount in the GeNHAp sample.

