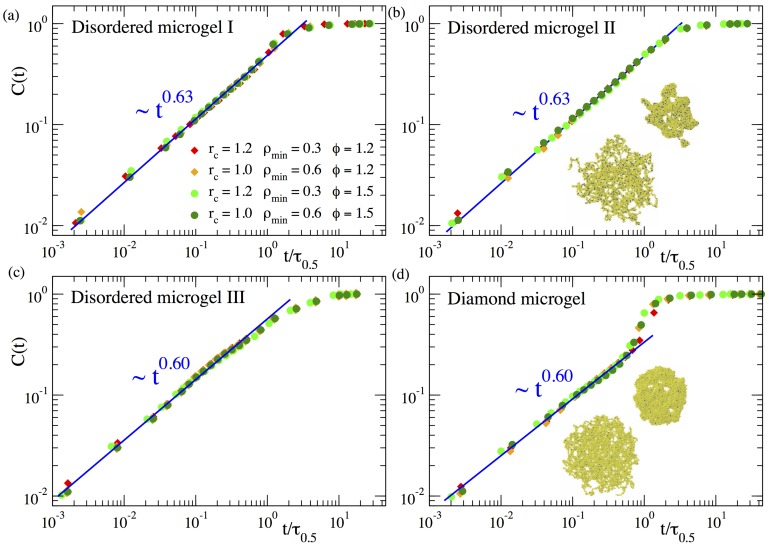
Figure 3.
Relative domain size over time during the collapse at and of three disordered microgels of small (a), middle (b) and large asphericity (c) and of a diamond microgel (d). Different datasets correspond to different values of the parameters and used to construct the density field. The time t is normalized by , defined as the time when . Straight lines in all panels fit to a power-law time dependence. Exponents are indicated. In panels (b,d) we show typical simulation snapshots at early and intermediate times.

