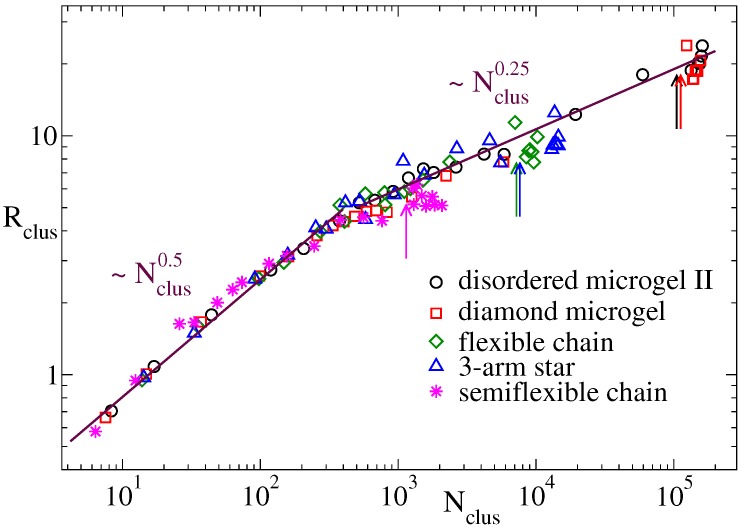
Figure 5.
Mean cluster radius vs. mean cluster population at , for clusters of filled cells in the density field representation with parameters and . Data are shown for the disordered microgel of middle asphericity, the diamond network, the three-arm star and the flexible and semiflexible linear chains. The arrows indicate the approximate cluster population at the saturation point prior the formation of the late plateau in . Lines are power-laws, exponents are indicated.

