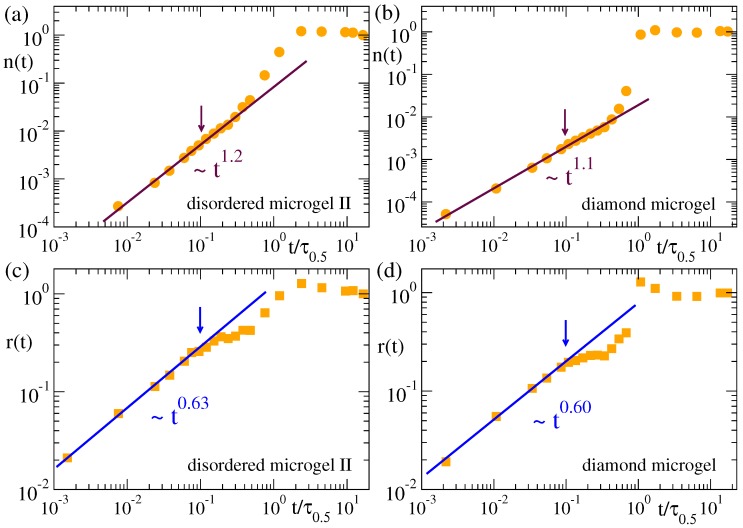
Figure 6.
Normalized population (a,b) and radius (c,d) of the clusters in the density field representation of the disordered microgel with middle asphericity (a,c) and the diamond microgel (b,d). Data correspond to a solvent quality parameter , and a density field representation with parameters and . The arrows indicate the time scale for which . Times are rescaled by as defined in Figure 3.

