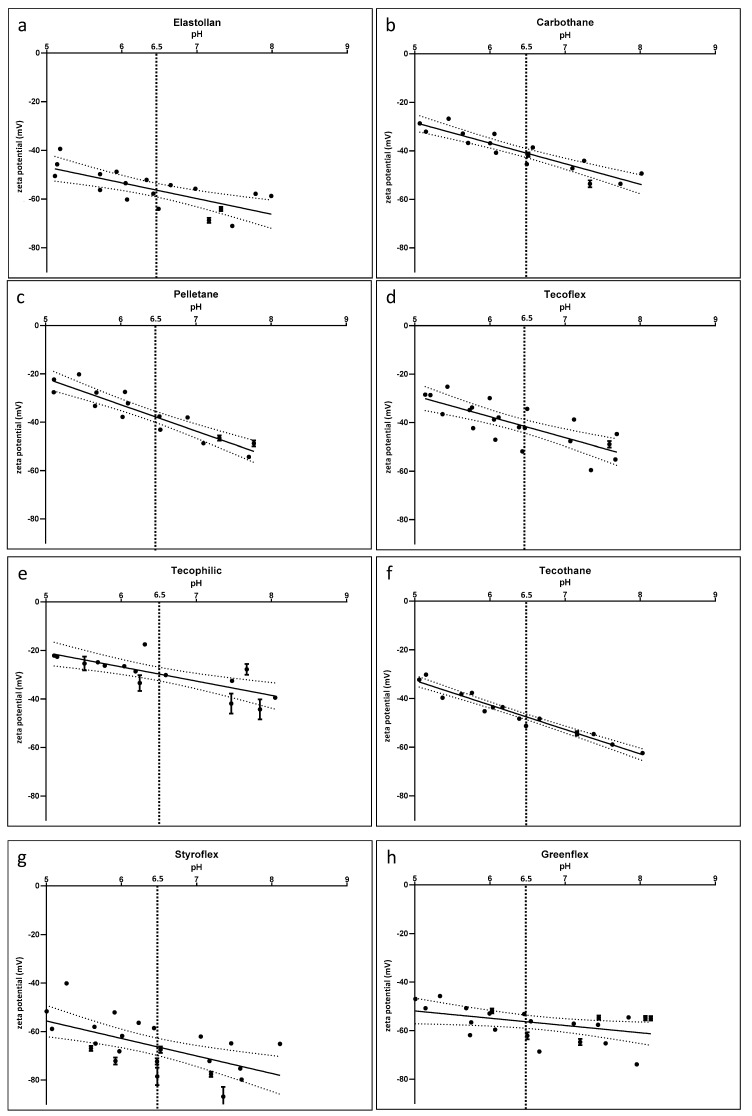
Figure 3.
Zeta potential of the polymers Elastollan (a), Carbothane (b), Pelletane (c), Tecoflex (d), Thecophilic (e), Tecothane (f), Styroflex (g) and Greenflex (h). The absolute values show a variation (with lowest absolute values for Styroflex, Greenflex, and Elastollan), while the slope of the curves is similar for all samples: decreasing zeta potential with increasing pH. pH 6.5 marks the average pH for urine. mean ± SD. Solid line marks mean, while dotted line shows the 75% confidence interval. n = 3 independent samples (SurPASS, Anton Paar).

